

Question: Figure 1 : Scatter plot of datasets and the initialized centers of 3 clusters Given the input matrix x whose rows represent different data points,
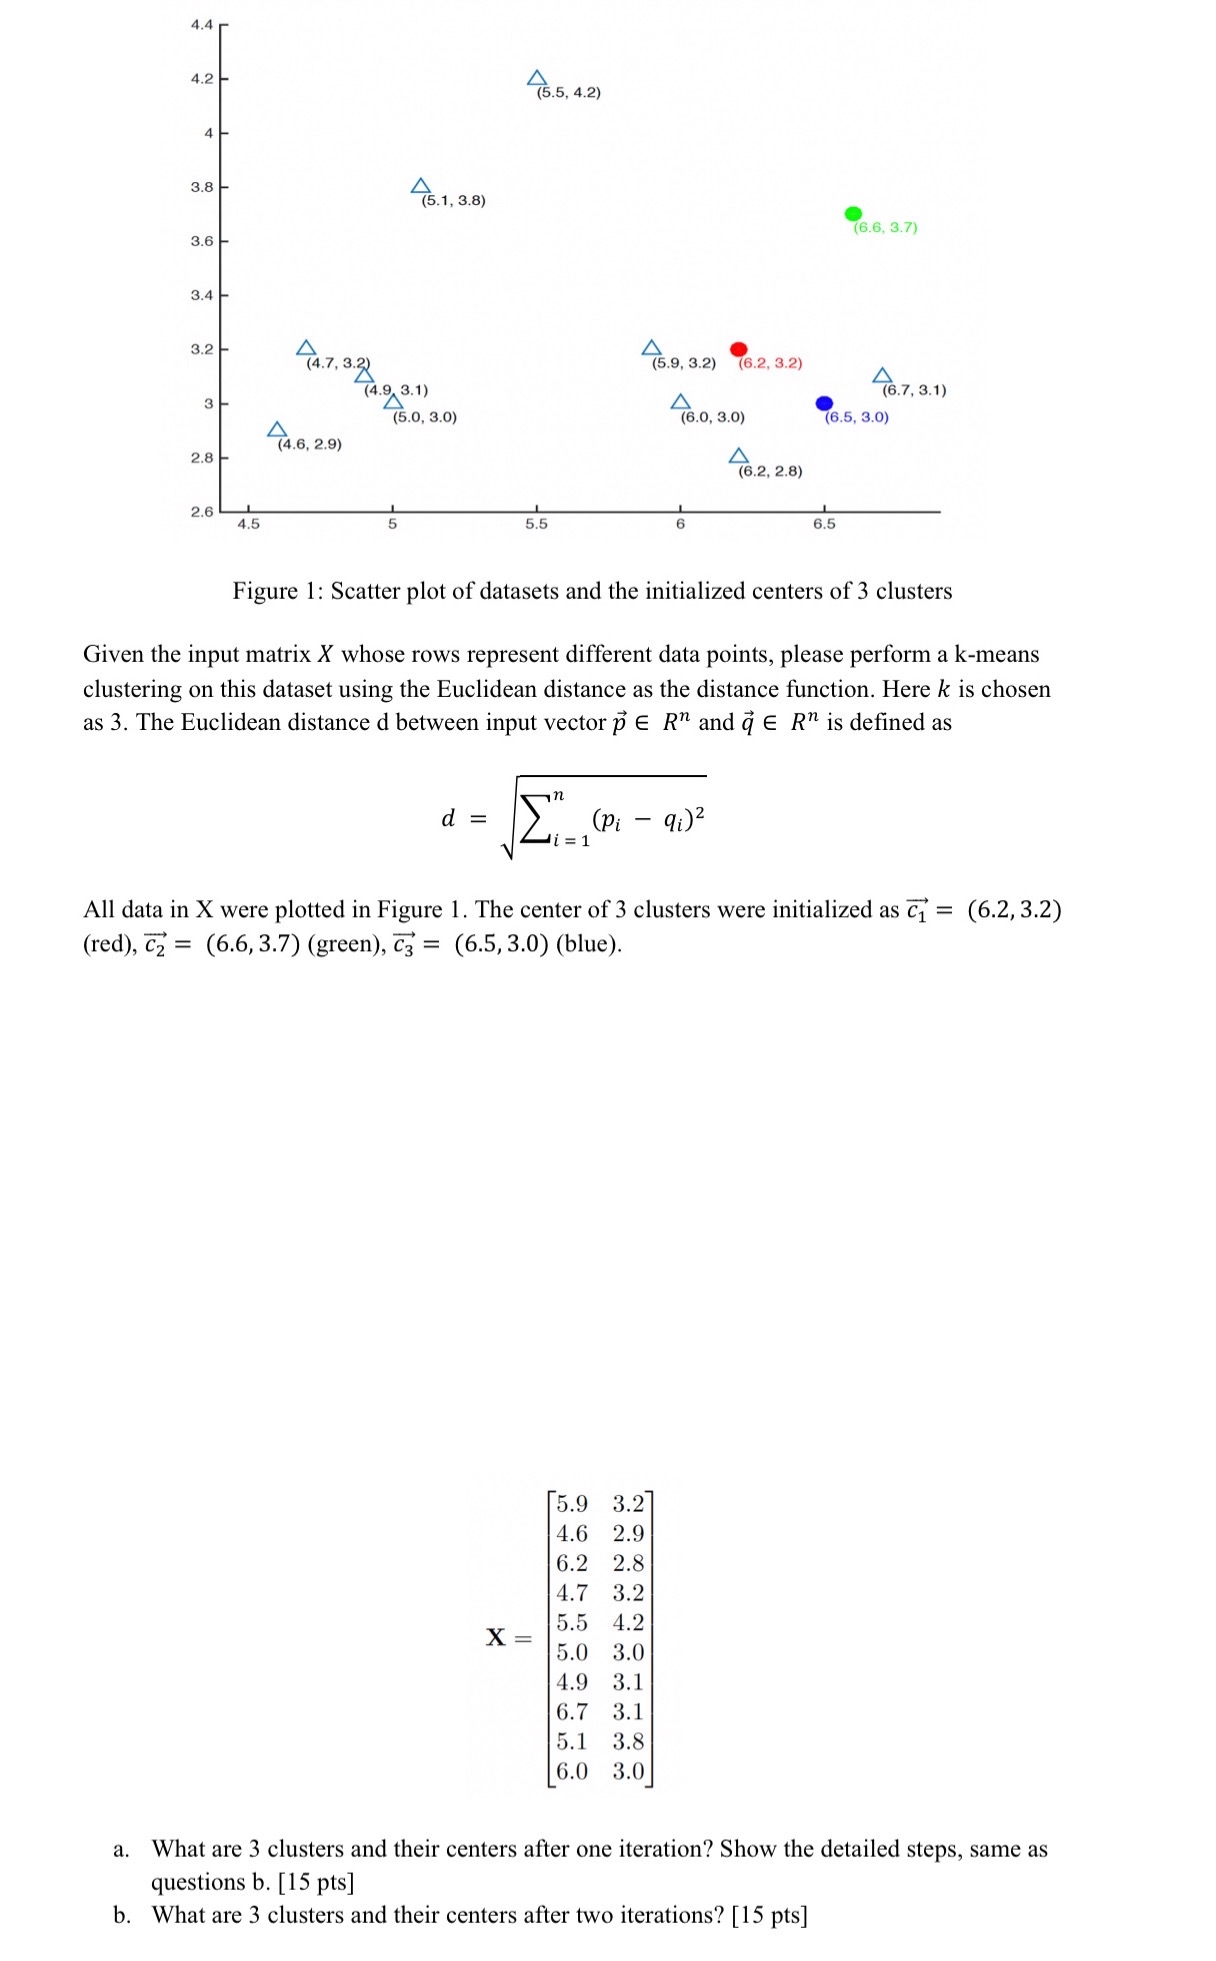
Figure : Scatter plot of datasets and the initialized centers of clusters
Given the input matrix whose rows represent different data points, please perform a kmeans clustering on this dataset using the Euclidean distance as the distance function. Here is chosen as The Euclidean distance d between input vector vec and vec is defined as
All data in X were plotted in Figure The center of clusters were initialized as vecred vecgreen vecblue
a What are clusters and their centers after one iteration? Show the detailed steps, same as questions b pts
b What are clusters and their centers after two iterations? pts
Step by Step Solution
There are 3 Steps involved in it
1 Expert Approved Answer
Step: 1 Unlock

Question Has Been Solved by an Expert!
Get step-by-step solutions from verified subject matter experts
Step: 2 Unlock
Step: 3 Unlock