

Question: Item 8 Constants Periodic Table (Figure 1) shows a history graph at x = 0 m of a wave moving to the right at
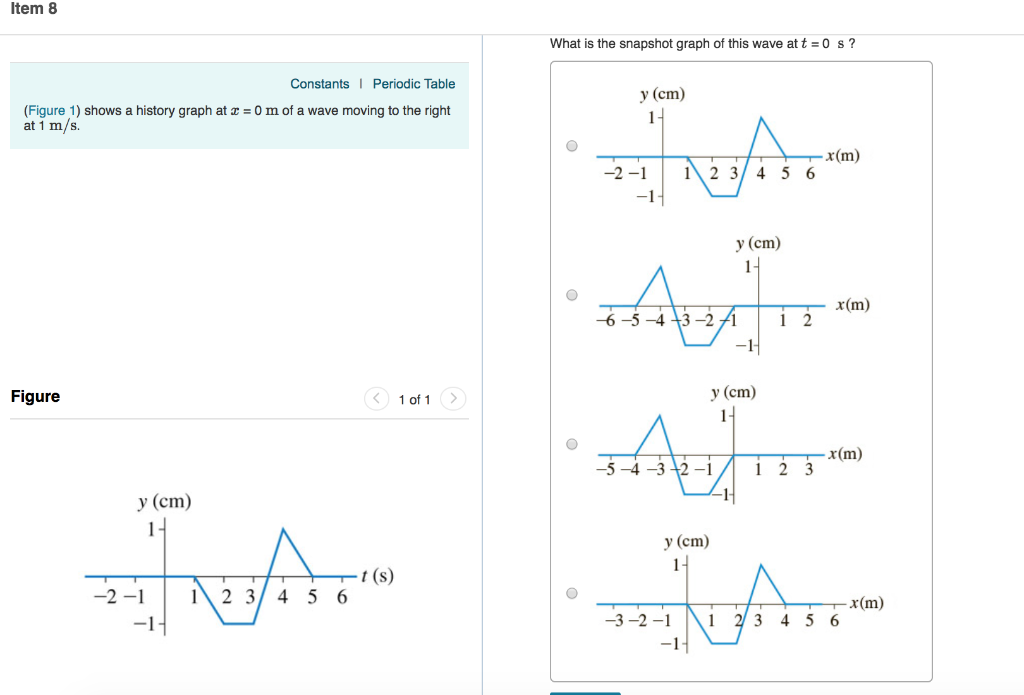
Item 8 Constants Periodic Table (Figure 1) shows a history graph at x = 0 m of a wave moving to the right at 1 m/s. Figure y (cm) 1- -2-1 -1- 2 3 4 5 6 ( 1 of 1 t (s) What is the snapshot graph of this wave at t=0 s? 0 y (cm) 1- -2-1 1 2 3 4 -1 --6-5-4-3-2/1 12 y (cm) -3-2-1 1 56 y (cm) 1- -1- -14 y (cm) 1- -4-3 2-1 12 3 .x(m) (m) (m) 4 56 x (m)
Step by Step Solution
★★★★★
3.47 Rating (157 Votes )
There are 3 Steps involved in it
1 Expert Approved Answer
Step: 1 Unlock

The detailed answer for the above ques... View full answer
Question Has Been Solved by an Expert!
Get step-by-step solutions from verified subject matter experts
Step: 2 Unlock
Step: 3 Unlock