

Question: Figure 1 shows a Statistical Report from the analysis study to analyze the logistics delivery performance of rental tools delivery for temporary import in DeltaCorp
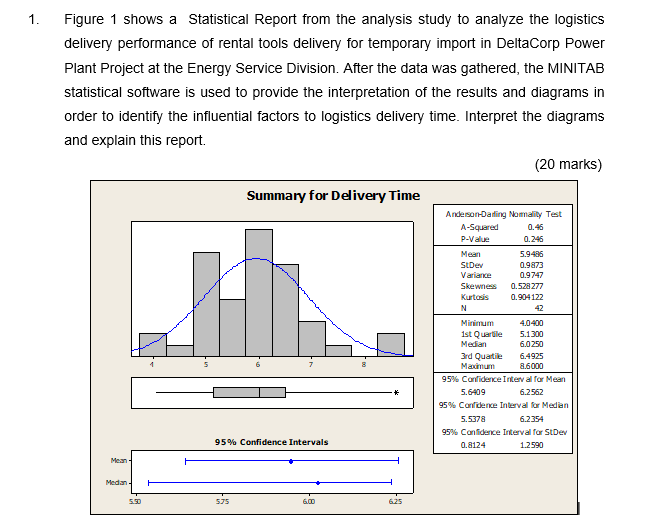
Figure 1 shows a Statistical Report from the analysis study to analyze the logistics delivery performance of rental tools delivery for temporary import in DeltaCorp Power Plant Project at the Energy Service Division. After the data was gathered, the MINITAB statistical software is used to provide the interpretation of the results and diagrams in order to identify the influential factors to logistics delivery time. Interpret the diagrams and explain this report. (20 marks)
Step by Step Solution
There are 3 Steps involved in it
1 Expert Approved Answer
Step: 1 Unlock

Question Has Been Solved by an Expert!
Get step-by-step solutions from verified subject matter experts
Step: 2 Unlock
Step: 3 Unlock