

Question: Figure 1: Speeding Up The Edit Experiment Dots Andlyse Insert Options Page Help 207 1.5- 1.0- Position (m 0.5- Time (s) Velocity (m's) 05. Time
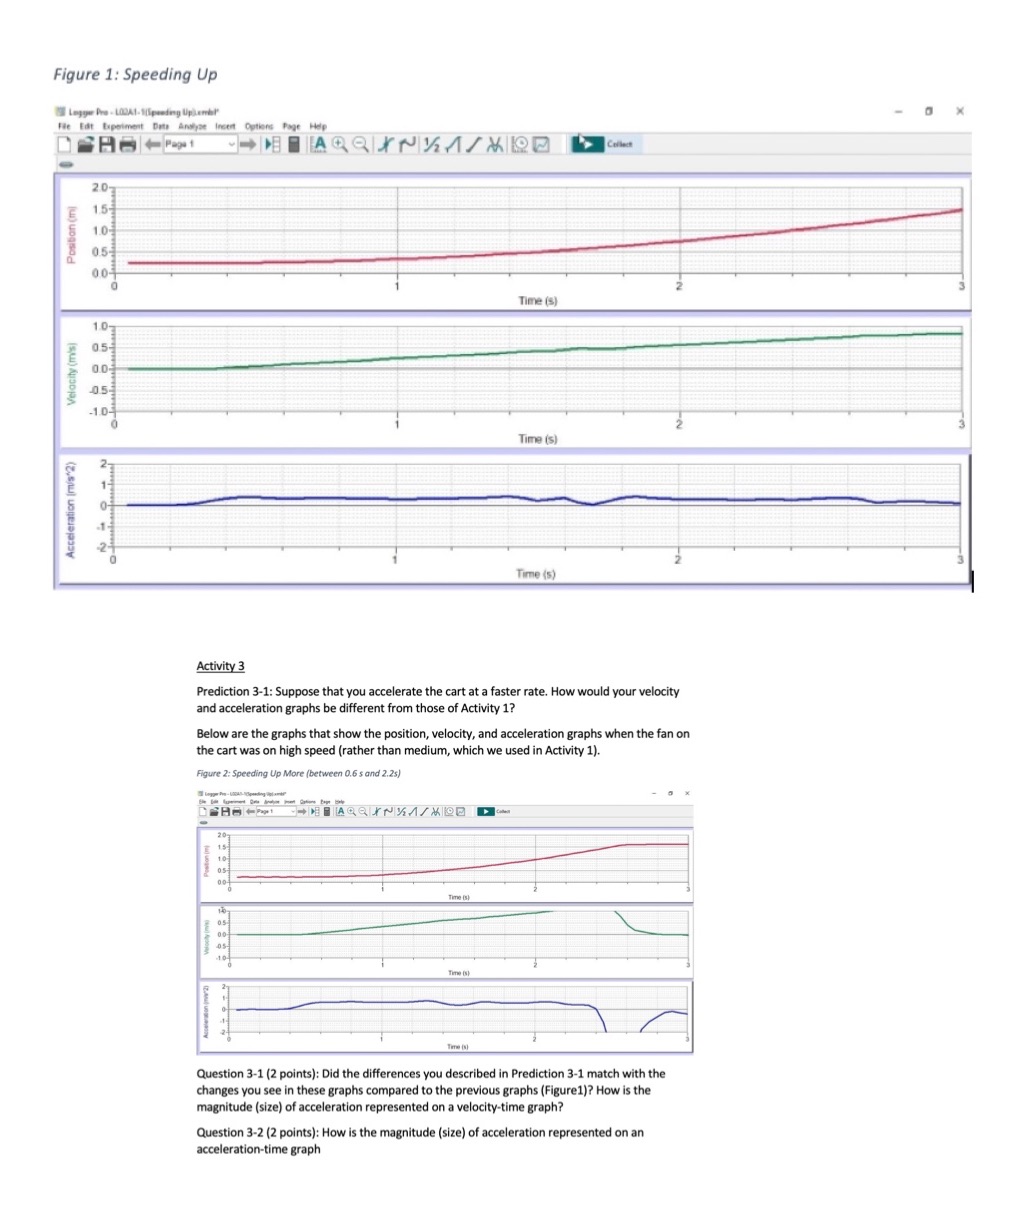
Figure 1: Speeding Up The Edit Experiment Dots Andlyse Insert Options Page Help 207 1.5- 1.0- Position (m 0.5- Time (s) Velocity (m's) 05. Time (s) Acceleration [mis*2) NEO-N Time (5) Activity 3 Prediction 3-1: Suppose that you accelerate the cart at a faster rate. How would your velocity and acceleration graphs be different from those of Activity 1? Below are the graphs that show the position, velocity, and acceleration graphs when the fan on the cart was on high speed (rather than medium, which we used in Activity 1). Figure 2: Speeding Up More (between 0.6 s and 2.2s) Postion int The () Acceleration grow-2 Question 3-1 (2 points): Did the differences you described in Prediction 3-1 match with the changes you see in these graphs compared to the previous graphs (Figure1)? How is the magnitude (size) of acceleration represented on a velocity-time graph? Question 3-2 (2 points): How is the magnitude (size) of acceleration represented on an acceleration-time graph
Step by Step Solution
There are 3 Steps involved in it

Get step-by-step solutions from verified subject matter experts