

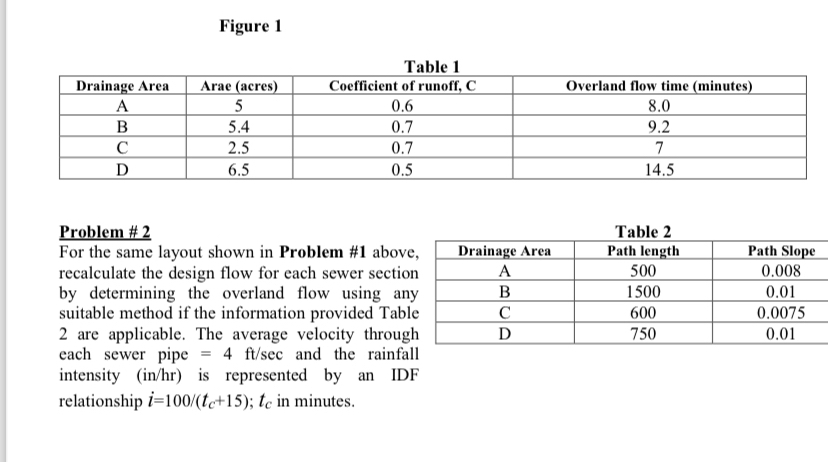
Question: Figure 1 Table 1 table [ [ Drainage Area,Arae ( acres ) , Coefficient of runoff, C , Overland flow time ( minutes )
Figure
Table
tableDrainage Area,Arae acresCoefficient of runoff, COverland flow time minutesABCD
Problem #
For the same layout shown in Problem # above, recalculate the design flow for each sewer section by determining the overland flow using any suitable method if the information provided Table are applicable. The average velocity through each sewer pipe and the rainfall intensity inhr is represented by an IDF relationship ; in minutes.
Table
tableDrainage Area,Path length,Path SlopeABCD
Step by Step Solution
There are 3 Steps involved in it
1 Expert Approved Answer
Step: 1 Unlock

Question Has Been Solved by an Expert!
Get step-by-step solutions from verified subject matter experts
Step: 2 Unlock
Step: 3 Unlock