

Question: Figure 1. Vertical ground reaction force and hip marker vertical position over time. Vertical GRFz and Hip Marker Vertical Position vs Time Comparison 3000 1.6
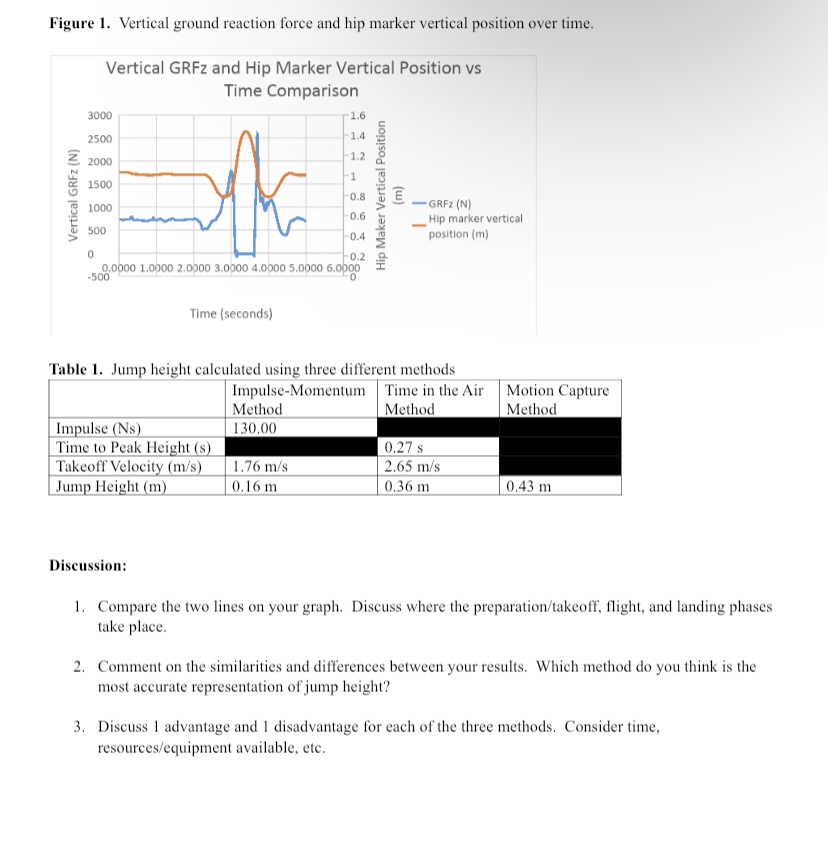
Figure 1. Vertical ground reaction force and hip marker vertical position over time. Vertical GRFz and Hip Marker Vertical Position vs Time Comparison 3000 1.6 2500 -1.4 2000 -1.2 -1 1500 -0.8 Hip Maker Vertical Position Vertical GRFz (N) E 1000 -GREZ (N) -0.6 Hip marker vertical 500 0.4 0 position (m) -0.2 0.0900 1.0000 2.0900 3.0000 4.0000 5.0000 6.0000 Time (seconds) Table 1. Jump height calculated using three different methods Impulse-Momentum Time in the Air Motion Capture Method Method Method Impulse (Ns) 130.00 Time to Peak Height (s) 0.27 s Takeoff Velocity (m/s) 1.76 m/s 2.65 m/s Jump Height (m) 0.16 m 0.36 m 0.43 m Discussion: 1. Compare the two lines on your graph. Discuss where the preparation/takeoff, flight, and landing phases take place. 2. Comment on the similarities and differences between your results. Which method do you think is the most accurate representation of jump height? 3. Discuss 1 advantage and 1 disadvantage for each of the three methods. Consider time, resources/equipment available, etc
Step by Step Solution
There are 3 Steps involved in it

Get step-by-step solutions from verified subject matter experts