

Question: Figure 1-1 The Five Forces Framework New effects Pero es Power of Input Suppliers Supplier concentration Price productivity of ternative inputs - Relationship-specific inve nts
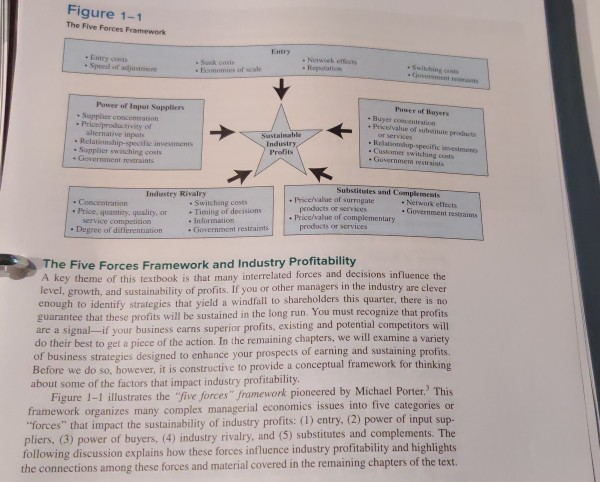
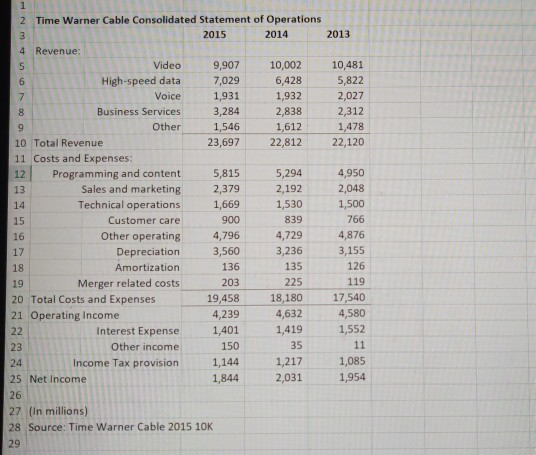
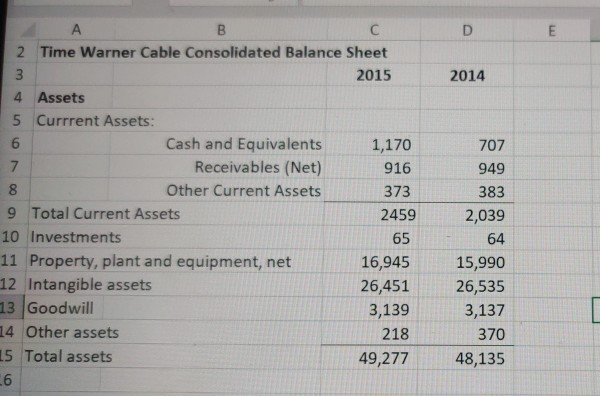
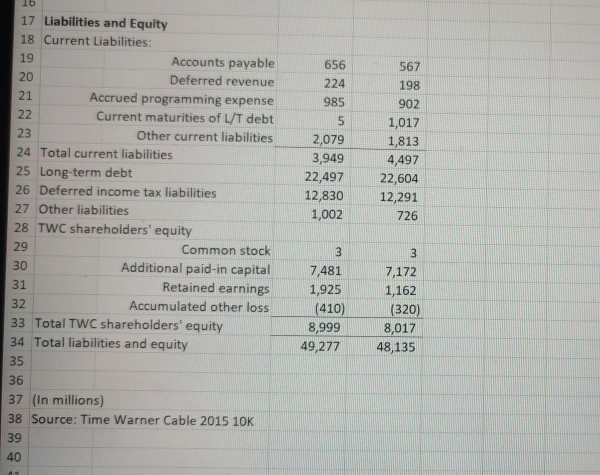
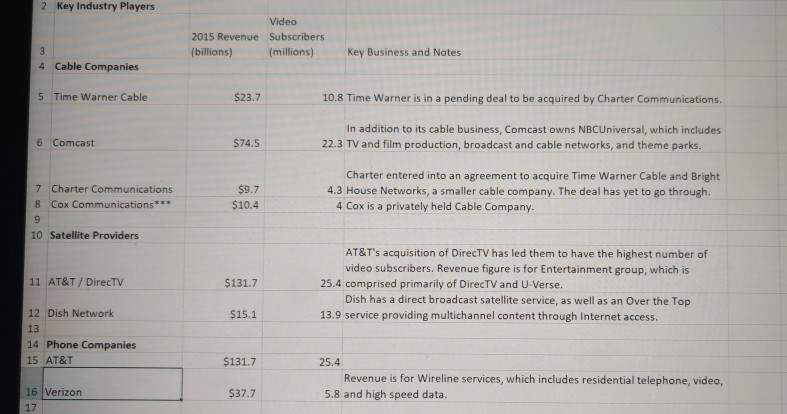
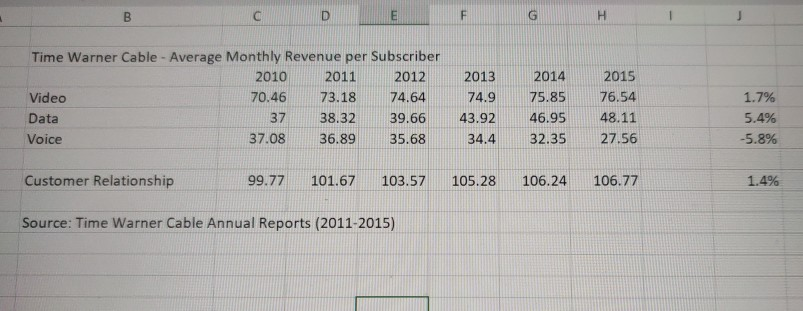
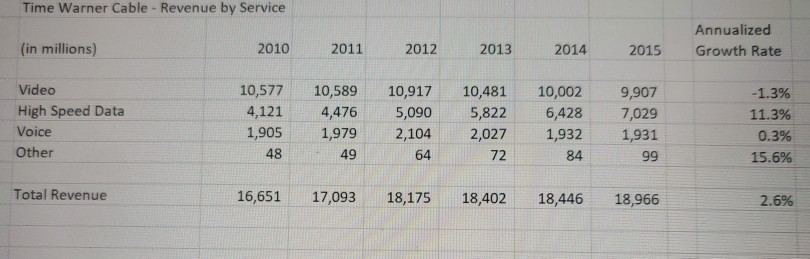
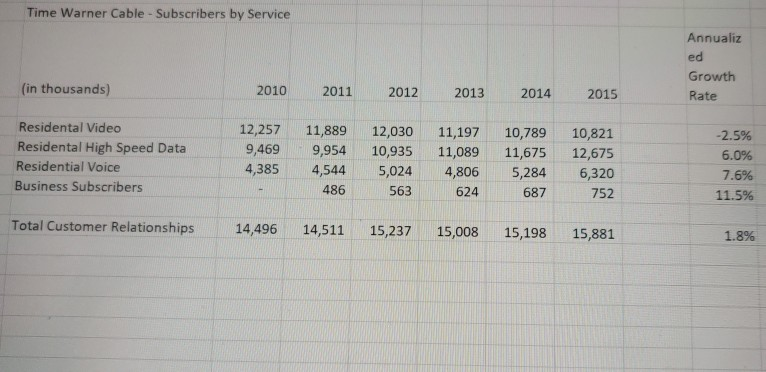
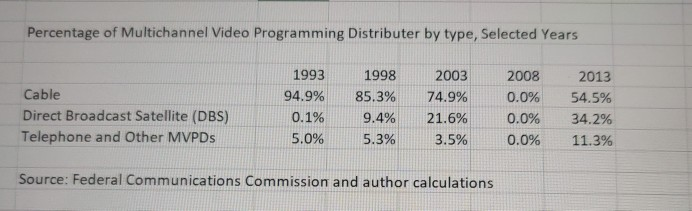
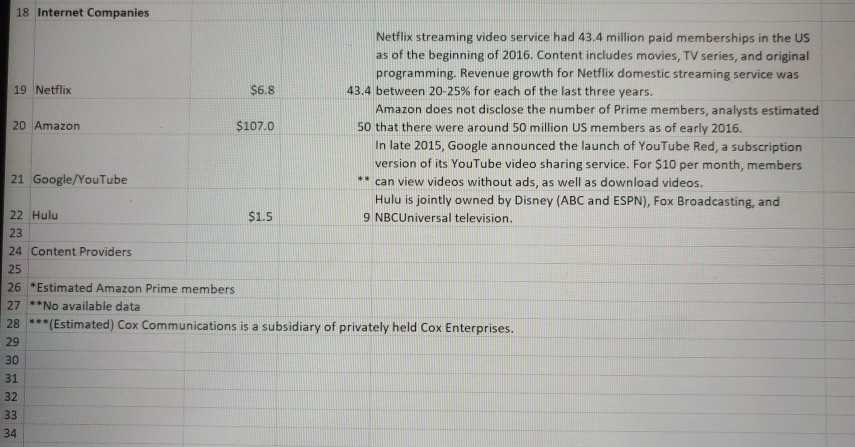
Figure 1-1 The Five Forces Framework New effects Pero es Power of Input Suppliers Supplier concentration Price productivity of ternative inputs - Relationship-specific inve nts Supplier switching costs vernment restraints Relationship specific . Government resti Industry Rivalry Concentration - Switching costs Price quantity, quality, or Timing of decisions - Information - Degree of differentiation . Government restraints Substitutes and Complements Price value of surrogate Network efects products or servis Government . Price value of complementary products or services CIVIL CODICI The Five Forces Framework and Industry Profitability A key theme of this textbook is that many interrelated forces and decisions influence the level, growth, and sustainability of profits. If you or other managers in the industry are clever enough to identify strategies that yield a windfall to shareholders this quarter, there is no guarantee that these profits will be sustained in the long run. You must recognize that profits are a signal if your business earns superior profits, existing and potential competitors will do their best to get a piece of the action. In the remaining chapters, we will examine a variety of business strategies designed to enhance your prospects of earning and sustaining profits Before we do so, however, it is constructive to provide a conceptual framework for thinking about some of the factors that impact industry profitability. Figure 1-1 illustrates the "five forces" framework pioneered by Michael Porter. This framework organizes many complex managerial economics issues into five categories or "forces" that impact the sustainability of industry profits: (1) entry, (2) power of input sup- pliers, (3) power of buyers, (4) industry rivalry, and (5) substitutes and complements. The following discussion explains how these forces influence industry profitability and highlights the connections among these forces and material covered in the remaining chapters of the text. Memo 3 To: Junior Executive, Strategy Group From: Vice President, Strategy Group Re: Strategic Analysis our upcoming executive retreat, the Strategy Group has been tasked competing a strategic analysis of our business and our industry. me there are a number of different approaches that we can take, would like to rely on Porter's "Five Forces" framework for our analysis of the industry structure. Please provide an outline of each of the five forces as it relates to the cable industry and whether conditions in the industry are favorable to long-term profitability. N 000 13 Time Warner Cable Consolidated Statement of Operations 2015 2014 2013 Revenue Video 9,907 10,002 10,481 High-speed data 7,029 6,428 5,822 Voice 1,931 1,932 2,027 Business Services 3,284 2,838 2,312 Other 1,546 1,612 1,478 10 Total Revenue 23,697 22,812 22,120 11 Costs and Expenses: 12 Programming and content 5,815 5,294 4,950 Sales and marketing 2,379 2,192 2,048 Technical operations 1,669 1,530 1,500 Customer care 900 839 766 Other operating 4,796 4,729 4,876 Depreciation 3,560 3,236 3,155 Amortization 136 135 126 Merger related costs 203 225 119 20 Total Costs and Expenses 19,458 18,180 17,540 21 Operating Income 4,239 4,632 4,580 Interest Expense 1,401 1,419 1,552 Other income 150 35 24 Income Tax provision 1,144 1,217 1,085 25 Net Income 1,844 2,031 1,954 27 (In millions) 28 Source: Time Warner Cable 2015 10K D 2014 8 2 Time Warner Cable Consolidated Balance Sheet 2015 4 Assets 5 Currrent Assets: Cash and Equivalents 1,170 Receivables (Net) 916 Other Current Assets 373 9 Total Current Assets 2459 10 Investments 65 11 Property, plant and equipment, net 16,945 12 Intangible assets 26,451 13 Goodwill 3,139 14 Other assets 218 15 Total assets 49,277 707 949 383 2,039 64 15,990 26,535 3,137 370 48,135 656 224 985 17 Liabilities and Equity Current Liabilities: Accounts payable Deferred revenue Accrued programming expense Current maturities of L/T debt Other current liabilities 24 Total current liabilities 25 Long-term debt 26 Deferred income tax liabilities 27 Other liabilities 28 TWC shareholders' equity Common stock Additional paid-in capital Retained earnings Accumulated other loss 33 Total TWC shareholders' equity 34 Total liabilities and equity 2,079 3,949 22,497 12,830 1,002 567 198 902 1,017 1,813 4,497 22,604 12,291 726 7,481 1,925 (410) 8,999 49,277 7,172 1,162 (320) 8,017 48,135 37 (In millions) 38 Source: Time Warner Cable 2015 10K 2 Key Industry Players Video 2015 Revenue Subscribers (billions) (millions) Key Business and Notes 4 Cable Companies 5 Time Warner Cable $23.7 10.8 Time Warner is in a pending deal to be acquired by Charter Communications. In addition to its cable business, Comcast owns NBCUniversal, which includes 22.3 TV and film production, broadcast and cable networks, and theme parks. 6 Comcast $74.5 7 Charter Communications 8 Cox Communications*** $9.7 $10.4 Charter entered into an agreement to acquire Time Warner Cable and Bright 4.3 House Networks, a smaller cable company. The deal has yet to go through. 4 Cox is a privately held Cable Company. 10 Satellite Providers 11 AT&T / DirecTV $131.7 AT&T's acquisition of DirecTV has led them to have the highest number of video subscribers. Revenue figure is for Entertainment group, which is 25.4 comprised primarily of DirecTV and U-Verse. Dish has a direct broadcast satellite service, as well as an Over the Top 13.9 service providing multichannel content through Internet access 12 Dish Network $15.1 13 14 Phone Companies 15 AT&T $131.7 25.4 Revenue is for Wireline services, which includes residential telephone, video, 5.8 and high speed data. 16 Verizon $37.7 17 Time Warner Cable - Average Monthly Revenue per Subscriber 2010 2011 2012 Video 70.46 73.18 74.64 Data 37 38.32 39.66 Voice 37.08 36.89 35.68 1.7% 2013 74.9 43.92 34.4 2014 75.85 46.95 32.35 2015 76.54 48.11 27.56 5.4% -5.8% Customer Relationship 99.77 101.67 103.57 105.28106.24 106.77 1.4% Source: Time Warner Cable Annual Reports (2011-2015) Time Warner Cable - Revenue by Service (in millions) 2010 2011 2012 2013 2014 Annualized Growth Rate 2015 Video High Speed Data Voice Other 10,577 4,121 1,905 10,589 4,476 1,979 49 10,917 5,090 2,104 64 10,481 5,822 2,027 10,002 6,428 1,932 9,907 7,029 1,931 99 -1.3% 11.3% 0.3% 15.6% 48 72 84 Total Revenue 16,651 17,093 18,175 18,402 18,446 18,966 2.6% Time Warner Cable - Subscribers by Service Annualiz ed (in thousands) 2010 2011 2012 2013 2014 Growth Rate 2015 Residental Video Residental High Speed Data Residential Voice Business Subscribers 12,257 11,889 9,4699 ,954 4,385 4,544 486 12,030 10,935 5,024 563 11,197 11,089 4,806 624 10,789 11,675 5,284 687 10,821 12,675 6,320 752 -2.5% 6.0% 7.6% 11.5% Total Customer Relationships 14,496 14,511 15,237 15,008 15,198 15,881 1.8% Percentage of Multichannel Video Programming Distributer by type, Selected Years Cable Direct Broadcast Satellite (DBS) Telephone and Other MVPDs 1993 94.9% 0.1% 5.0% 1998 85.3% 9.4% 5.3% 2003 74.9% 21.6% 3.5% 2008 0.0% 0.0% 0.0% 2013 54.5% 34.2% 11.3% Source: Federal Communications Commission and author calculations 18 Internet Companies 19 Netflix $6.8 20 Amazon $107.0 Netflix streaming video service had 43.4 million paid memberships in the US as of the beginning of 2016. Content includes movies, TV series, and original programming. Revenue growth for Netflix domestic streaming service was 43.4 between 20-25% for each of the last three years. Amazon does not disclose the number of Prime members, analysts estimated 50 that there were around 50 million US members as of early 2016. In late 2015, Google announced the launch of YouTube Red, a subscription version of its YouTube video sharing service. For $10 per month, members can view videos without ads, as well as download videos Hulu is jointly owned by Disney (ABC and ESPN), Fox Broadcasting, and 9 NBCUniversal television. 21 Google/YouTube 22 Hulu $1.5 24 Content Providers 26 "Estimated Amazon Prime members 27 **No available data 28 ***(Estimated) Cox Communications is a subsidiary of privately held Cox Enterprises. Figure 1-1 The Five Forces Framework New effects Pero es Power of Input Suppliers Supplier concentration Price productivity of ternative inputs - Relationship-specific inve nts Supplier switching costs vernment restraints Relationship specific . Government resti Industry Rivalry Concentration - Switching costs Price quantity, quality, or Timing of decisions - Information - Degree of differentiation . Government restraints Substitutes and Complements Price value of surrogate Network efects products or servis Government . Price value of complementary products or services CIVIL CODICI The Five Forces Framework and Industry Profitability A key theme of this textbook is that many interrelated forces and decisions influence the level, growth, and sustainability of profits. If you or other managers in the industry are clever enough to identify strategies that yield a windfall to shareholders this quarter, there is no guarantee that these profits will be sustained in the long run. You must recognize that profits are a signal if your business earns superior profits, existing and potential competitors will do their best to get a piece of the action. In the remaining chapters, we will examine a variety of business strategies designed to enhance your prospects of earning and sustaining profits Before we do so, however, it is constructive to provide a conceptual framework for thinking about some of the factors that impact industry profitability. Figure 1-1 illustrates the "five forces" framework pioneered by Michael Porter. This framework organizes many complex managerial economics issues into five categories or "forces" that impact the sustainability of industry profits: (1) entry, (2) power of input sup- pliers, (3) power of buyers, (4) industry rivalry, and (5) substitutes and complements. The following discussion explains how these forces influence industry profitability and highlights the connections among these forces and material covered in the remaining chapters of the text. Memo 3 To: Junior Executive, Strategy Group From: Vice President, Strategy Group Re: Strategic Analysis our upcoming executive retreat, the Strategy Group has been tasked competing a strategic analysis of our business and our industry. me there are a number of different approaches that we can take, would like to rely on Porter's "Five Forces" framework for our analysis of the industry structure. Please provide an outline of each of the five forces as it relates to the cable industry and whether conditions in the industry are favorable to long-term profitability. N 000 13 Time Warner Cable Consolidated Statement of Operations 2015 2014 2013 Revenue Video 9,907 10,002 10,481 High-speed data 7,029 6,428 5,822 Voice 1,931 1,932 2,027 Business Services 3,284 2,838 2,312 Other 1,546 1,612 1,478 10 Total Revenue 23,697 22,812 22,120 11 Costs and Expenses: 12 Programming and content 5,815 5,294 4,950 Sales and marketing 2,379 2,192 2,048 Technical operations 1,669 1,530 1,500 Customer care 900 839 766 Other operating 4,796 4,729 4,876 Depreciation 3,560 3,236 3,155 Amortization 136 135 126 Merger related costs 203 225 119 20 Total Costs and Expenses 19,458 18,180 17,540 21 Operating Income 4,239 4,632 4,580 Interest Expense 1,401 1,419 1,552 Other income 150 35 24 Income Tax provision 1,144 1,217 1,085 25 Net Income 1,844 2,031 1,954 27 (In millions) 28 Source: Time Warner Cable 2015 10K D 2014 8 2 Time Warner Cable Consolidated Balance Sheet 2015 4 Assets 5 Currrent Assets: Cash and Equivalents 1,170 Receivables (Net) 916 Other Current Assets 373 9 Total Current Assets 2459 10 Investments 65 11 Property, plant and equipment, net 16,945 12 Intangible assets 26,451 13 Goodwill 3,139 14 Other assets 218 15 Total assets 49,277 707 949 383 2,039 64 15,990 26,535 3,137 370 48,135 656 224 985 17 Liabilities and Equity Current Liabilities: Accounts payable Deferred revenue Accrued programming expense Current maturities of L/T debt Other current liabilities 24 Total current liabilities 25 Long-term debt 26 Deferred income tax liabilities 27 Other liabilities 28 TWC shareholders' equity Common stock Additional paid-in capital Retained earnings Accumulated other loss 33 Total TWC shareholders' equity 34 Total liabilities and equity 2,079 3,949 22,497 12,830 1,002 567 198 902 1,017 1,813 4,497 22,604 12,291 726 7,481 1,925 (410) 8,999 49,277 7,172 1,162 (320) 8,017 48,135 37 (In millions) 38 Source: Time Warner Cable 2015 10K 2 Key Industry Players Video 2015 Revenue Subscribers (billions) (millions) Key Business and Notes 4 Cable Companies 5 Time Warner Cable $23.7 10.8 Time Warner is in a pending deal to be acquired by Charter Communications. In addition to its cable business, Comcast owns NBCUniversal, which includes 22.3 TV and film production, broadcast and cable networks, and theme parks. 6 Comcast $74.5 7 Charter Communications 8 Cox Communications*** $9.7 $10.4 Charter entered into an agreement to acquire Time Warner Cable and Bright 4.3 House Networks, a smaller cable company. The deal has yet to go through. 4 Cox is a privately held Cable Company. 10 Satellite Providers 11 AT&T / DirecTV $131.7 AT&T's acquisition of DirecTV has led them to have the highest number of video subscribers. Revenue figure is for Entertainment group, which is 25.4 comprised primarily of DirecTV and U-Verse. Dish has a direct broadcast satellite service, as well as an Over the Top 13.9 service providing multichannel content through Internet access 12 Dish Network $15.1 13 14 Phone Companies 15 AT&T $131.7 25.4 Revenue is for Wireline services, which includes residential telephone, video, 5.8 and high speed data. 16 Verizon $37.7 17 Time Warner Cable - Average Monthly Revenue per Subscriber 2010 2011 2012 Video 70.46 73.18 74.64 Data 37 38.32 39.66 Voice 37.08 36.89 35.68 1.7% 2013 74.9 43.92 34.4 2014 75.85 46.95 32.35 2015 76.54 48.11 27.56 5.4% -5.8% Customer Relationship 99.77 101.67 103.57 105.28106.24 106.77 1.4% Source: Time Warner Cable Annual Reports (2011-2015) Time Warner Cable - Revenue by Service (in millions) 2010 2011 2012 2013 2014 Annualized Growth Rate 2015 Video High Speed Data Voice Other 10,577 4,121 1,905 10,589 4,476 1,979 49 10,917 5,090 2,104 64 10,481 5,822 2,027 10,002 6,428 1,932 9,907 7,029 1,931 99 -1.3% 11.3% 0.3% 15.6% 48 72 84 Total Revenue 16,651 17,093 18,175 18,402 18,446 18,966 2.6% Time Warner Cable - Subscribers by Service Annualiz ed (in thousands) 2010 2011 2012 2013 2014 Growth Rate 2015 Residental Video Residental High Speed Data Residential Voice Business Subscribers 12,257 11,889 9,4699 ,954 4,385 4,544 486 12,030 10,935 5,024 563 11,197 11,089 4,806 624 10,789 11,675 5,284 687 10,821 12,675 6,320 752 -2.5% 6.0% 7.6% 11.5% Total Customer Relationships 14,496 14,511 15,237 15,008 15,198 15,881 1.8% Percentage of Multichannel Video Programming Distributer by type, Selected Years Cable Direct Broadcast Satellite (DBS) Telephone and Other MVPDs 1993 94.9% 0.1% 5.0% 1998 85.3% 9.4% 5.3% 2003 74.9% 21.6% 3.5% 2008 0.0% 0.0% 0.0% 2013 54.5% 34.2% 11.3% Source: Federal Communications Commission and author calculations 18 Internet Companies 19 Netflix $6.8 20 Amazon $107.0 Netflix streaming video service had 43.4 million paid memberships in the US as of the beginning of 2016. Content includes movies, TV series, and original programming. Revenue growth for Netflix domestic streaming service was 43.4 between 20-25% for each of the last three years. Amazon does not disclose the number of Prime members, analysts estimated 50 that there were around 50 million US members as of early 2016. In late 2015, Google announced the launch of YouTube Red, a subscription version of its YouTube video sharing service. For $10 per month, members can view videos without ads, as well as download videos Hulu is jointly owned by Disney (ABC and ESPN), Fox Broadcasting, and 9 NBCUniversal television. 21 Google/YouTube 22 Hulu $1.5 24 Content Providers 26 "Estimated Amazon Prime members 27 **No available data 28 ***(Estimated) Cox Communications is a subsidiary of privately held Cox Enterprises
Step by Step Solution
There are 3 Steps involved in it

Get step-by-step solutions from verified subject matter experts