

Question: Figure 14.5 given below (Source: Lange et al., 2018, p.514) provides Net Deposit Drain (NDD) distributions for Bank Alpha [in Figure 14.5 (a)] and Bank
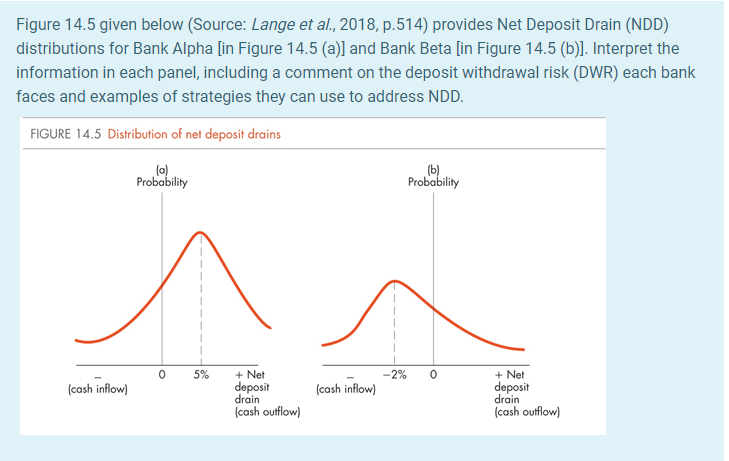
Figure 14.5 given below (Source: Lange et al., 2018, p.514) provides Net Deposit Drain (NDD) distributions for Bank Alpha [in Figure 14.5 (a)] and Bank Beta (in Figure 14.5 (b)]. Interpret the information in each panel, including a comment on the deposit withdrawal risk (DWR) each bank faces and examples of strategies they can use to address NDD. FIGURE 14.5 Distribution of net deposit drains Probability (b) Probability 0 5% -2% 0 (cash inflow) + Net deposit drain (cash outflow) (cash inflow) + Net deposit drain (cash outflow) Figure 14.5 given below (Source: Lange et al., 2018, p.514) provides Net Deposit Drain (NDD) distributions for Bank Alpha [in Figure 14.5 (a)] and Bank Beta (in Figure 14.5 (b)]. Interpret the information in each panel, including a comment on the deposit withdrawal risk (DWR) each bank faces and examples of strategies they can use to address NDD. FIGURE 14.5 Distribution of net deposit drains Probability (b) Probability 0 5% -2% 0 (cash inflow) + Net deposit drain (cash outflow) (cash inflow) + Net deposit drain (cash outflow)
Step by Step Solution
There are 3 Steps involved in it

Get step-by-step solutions from verified subject matter experts