

Question: Figure 14.5 given below (Source: Lange et al., 2018, p.514) provides Net Deposit Drain (NDD) distributions for Bank Alpha (in Figure 14.5 (a)] and Bank
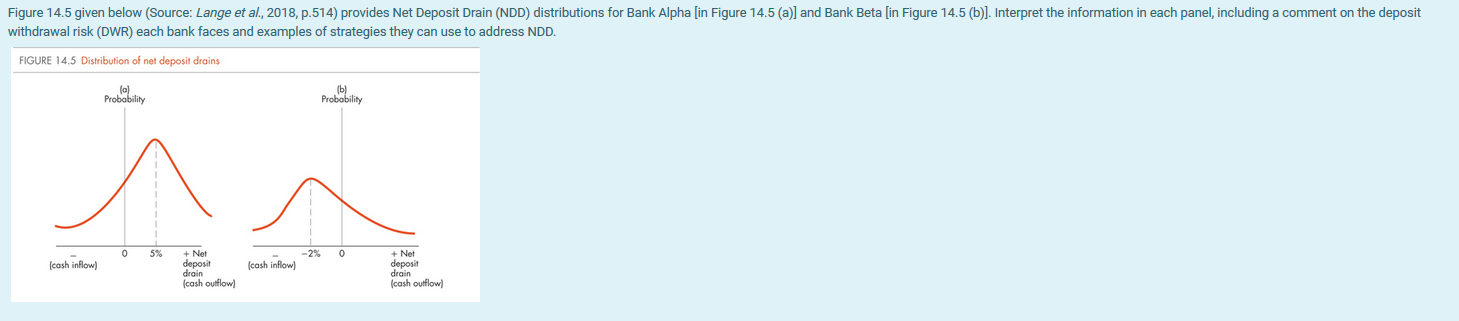
Figure 14.5 given below (Source: Lange et al., 2018, p.514) provides Net Deposit Drain (NDD) distributions for Bank Alpha (in Figure 14.5 (a)] and Bank Beta [in Figure 14.5 (b)]. Interpret the information in each panel, including a comment on the deposit withdrawal risk (DWR) each bank faces and examples of strategies they can use to address NDD. FIGURE 14.5 Distribution of net deposit drains lal Probability b) Probability 0 5% + Net -2% 0 + Net (cash inflow) dopose cash inflow) doposit drain cash outflow) drain (cash outflow Figure 14.5 given below (Source: Lange et al., 2018, p.514) provides Net Deposit Drain (NDD) distributions for Bank Alpha (in Figure 14.5 (a)] and Bank Beta [in Figure 14.5 (b)]. Interpret the information in each panel, including a comment on the deposit withdrawal risk (DWR) each bank faces and examples of strategies they can use to address NDD. FIGURE 14.5 Distribution of net deposit drains lal Probability b) Probability 0 5% + Net -2% 0 + Net (cash inflow) dopose cash inflow) doposit drain cash outflow) drain (cash outflow
Step by Step Solution
There are 3 Steps involved in it

Get step-by-step solutions from verified subject matter experts