

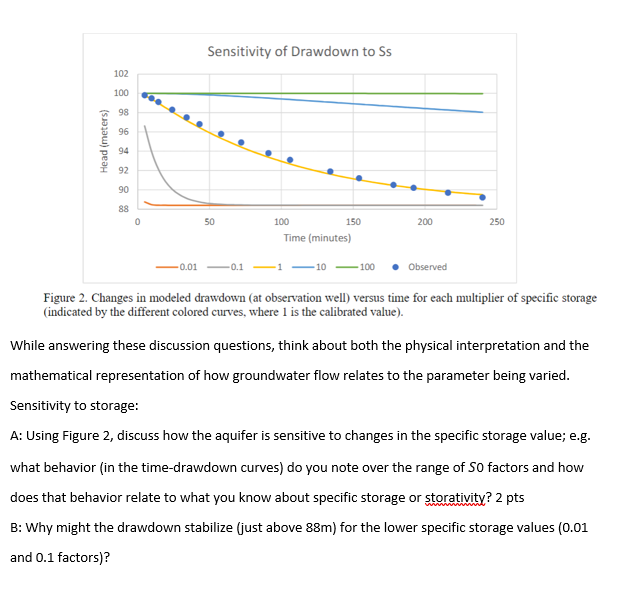
Question: Figure 2 . Changes in modeled drawdown ( at observation well ) versus time for each multiplier of specific storage ( indicated by the different
Figure Changes in modeled drawdown at observation well versus time for each multiplier of specific storage
indicated by the different colored curves, where is the calibrated value
While answering these discussion questions, think about both the physical interpretation and the
mathematical representation of how groundwater flow relates to the parameter being varied.
Sensitivity to storage:
A: Using Figure discuss how the aquifer is sensitive to changes in the specific storage value; eg
what behavior in the timedrawdown curves do you note over the range of factors and how
does that behavior relate to what you know about specific storage or storativity? pts
B: Why might the drawdown stabilize just above for the lower specific storage values
and factors
Step by Step Solution
There are 3 Steps involved in it
1 Expert Approved Answer
Step: 1 Unlock

Question Has Been Solved by an Expert!
Get step-by-step solutions from verified subject matter experts
Step: 2 Unlock
Step: 3 Unlock