

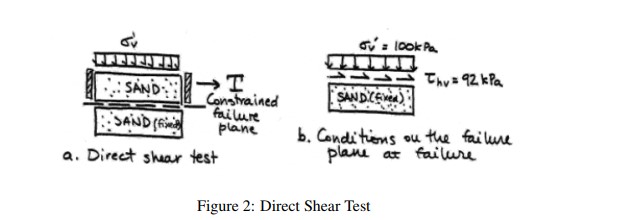
Question: Figure 2 illustrates a direct shear test on a sample of clean sand at an initial relative density of Dr = 6 5 % .
Figure illustrates a direct shear test on a sample of clean sand at an initial relative
density of Dr Figure a shows the test and sample configuration and Figure b shows
the conditions at failuredefined as maximum obliquity sigma sigma The sample is dry.
a What is the peak friction angle based on this test?
b Determine the magnitudes and orientations of sigma and sigma at failure. Draw a simple figure to
illustrate your answer.a Direct shear test
b Conditions on the failure
plane at failure
Figure : Direct Shear Test
Step by Step Solution
There are 3 Steps involved in it
1 Expert Approved Answer
Step: 1 Unlock

Question Has Been Solved by an Expert!
Get step-by-step solutions from verified subject matter experts
Step: 2 Unlock
Step: 3 Unlock