

Question: Figure 2 Linear Regression Graph Phase#1 Phase = Phase #1 Fitted line Mx Days 25 20 15 2005 2010 2015 2020
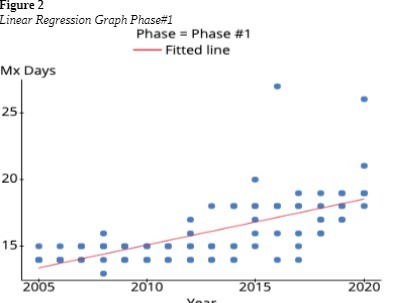

Figure 2 Linear Regression Graph Phase#1 Phase = Phase #1 Fitted line Mx Days 25 20 15 2005 2010 2015 2020
Step by Step Solution
There are 3 Steps involved in it
1 Expert Approved Answer
Step: 1 Unlock

Question Has Been Solved by an Expert!
Get step-by-step solutions from verified subject matter experts
Step: 2 Unlock
Step: 3 Unlock