

Question: Figure 2 shows the scatter plot between salmon vs. sea bass, with respect to two features: width and lightness. If the solid curve is
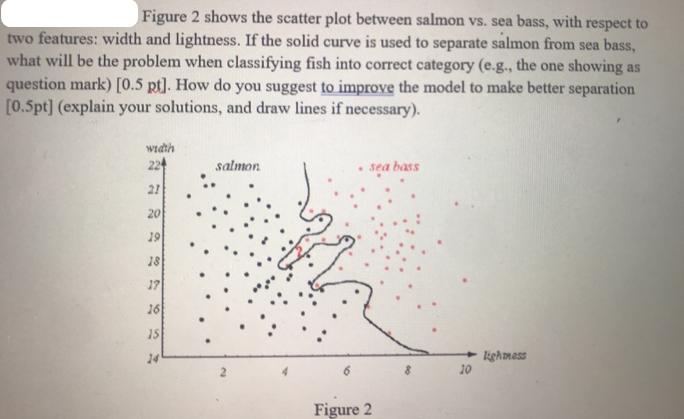
Figure 2 shows the scatter plot between salmon vs. sea bass, with respect to two features: width and lightness. If the solid curve is used to separate salmon from sea bass, what will be the problem when classifying fish into correct category (e.g., the one showing as question mark) [0.5 pt]. How do you suggest to improve the model to make better separation [0.5pt] (explain your solutions, and draw lines if necessary). width 22 salmon 21 20 19 18 17 16 15 Figure 2 sea bass Lighmess 10
Step by Step Solution
There are 3 Steps involved in it
1 Expert Approved Answer
Step: 1 Unlock

Question Has Been Solved by an Expert!
Get step-by-step solutions from verified subject matter experts
Step: 2 Unlock
Step: 3 Unlock