

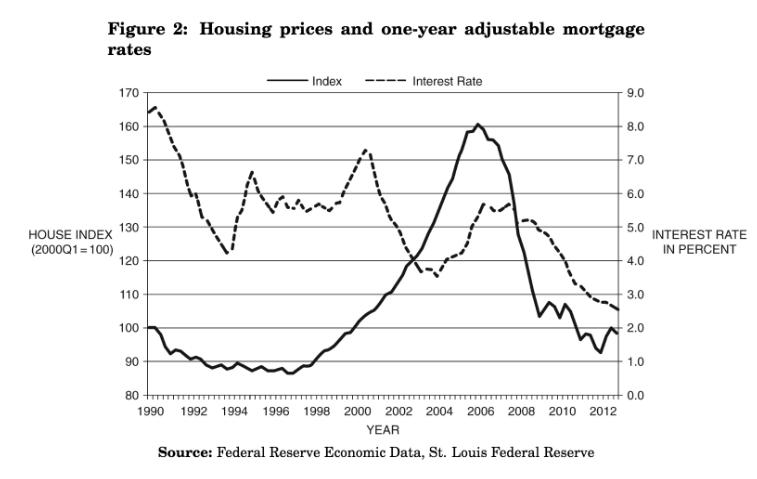
Figure 2 shows the U.S. housing price index (solid line, left axis) and one-year adjustable mortgage rates
Fantastic news! We've Found the answer you've been seeking!
Question:
Figure 2 shows the U.S. housing price index (solid line, left axis) and one-year adjustable mortgage rates - a proxy for subprime loans (dashed line, right axis). In the context of the housing and financial crisis, discuss the relationship between these two series.
Expert Answer:
Figure 2 shows the US housing price index solid line left axis and oneyear adjustable mortgage rates ... View the full answer

Related Book For 

Principles of Managerial Finance
ISBN: 978-0134476315
15th edition
Authors: Chad J. Zutter, Scott B. Smart
Posted Date:
