

Question: Figure 4.1 Econom E Using the data from the National Bureau of Economic Research (NBER) report, http://www.nber.org/cycles.html, and what you learned in lecture and the
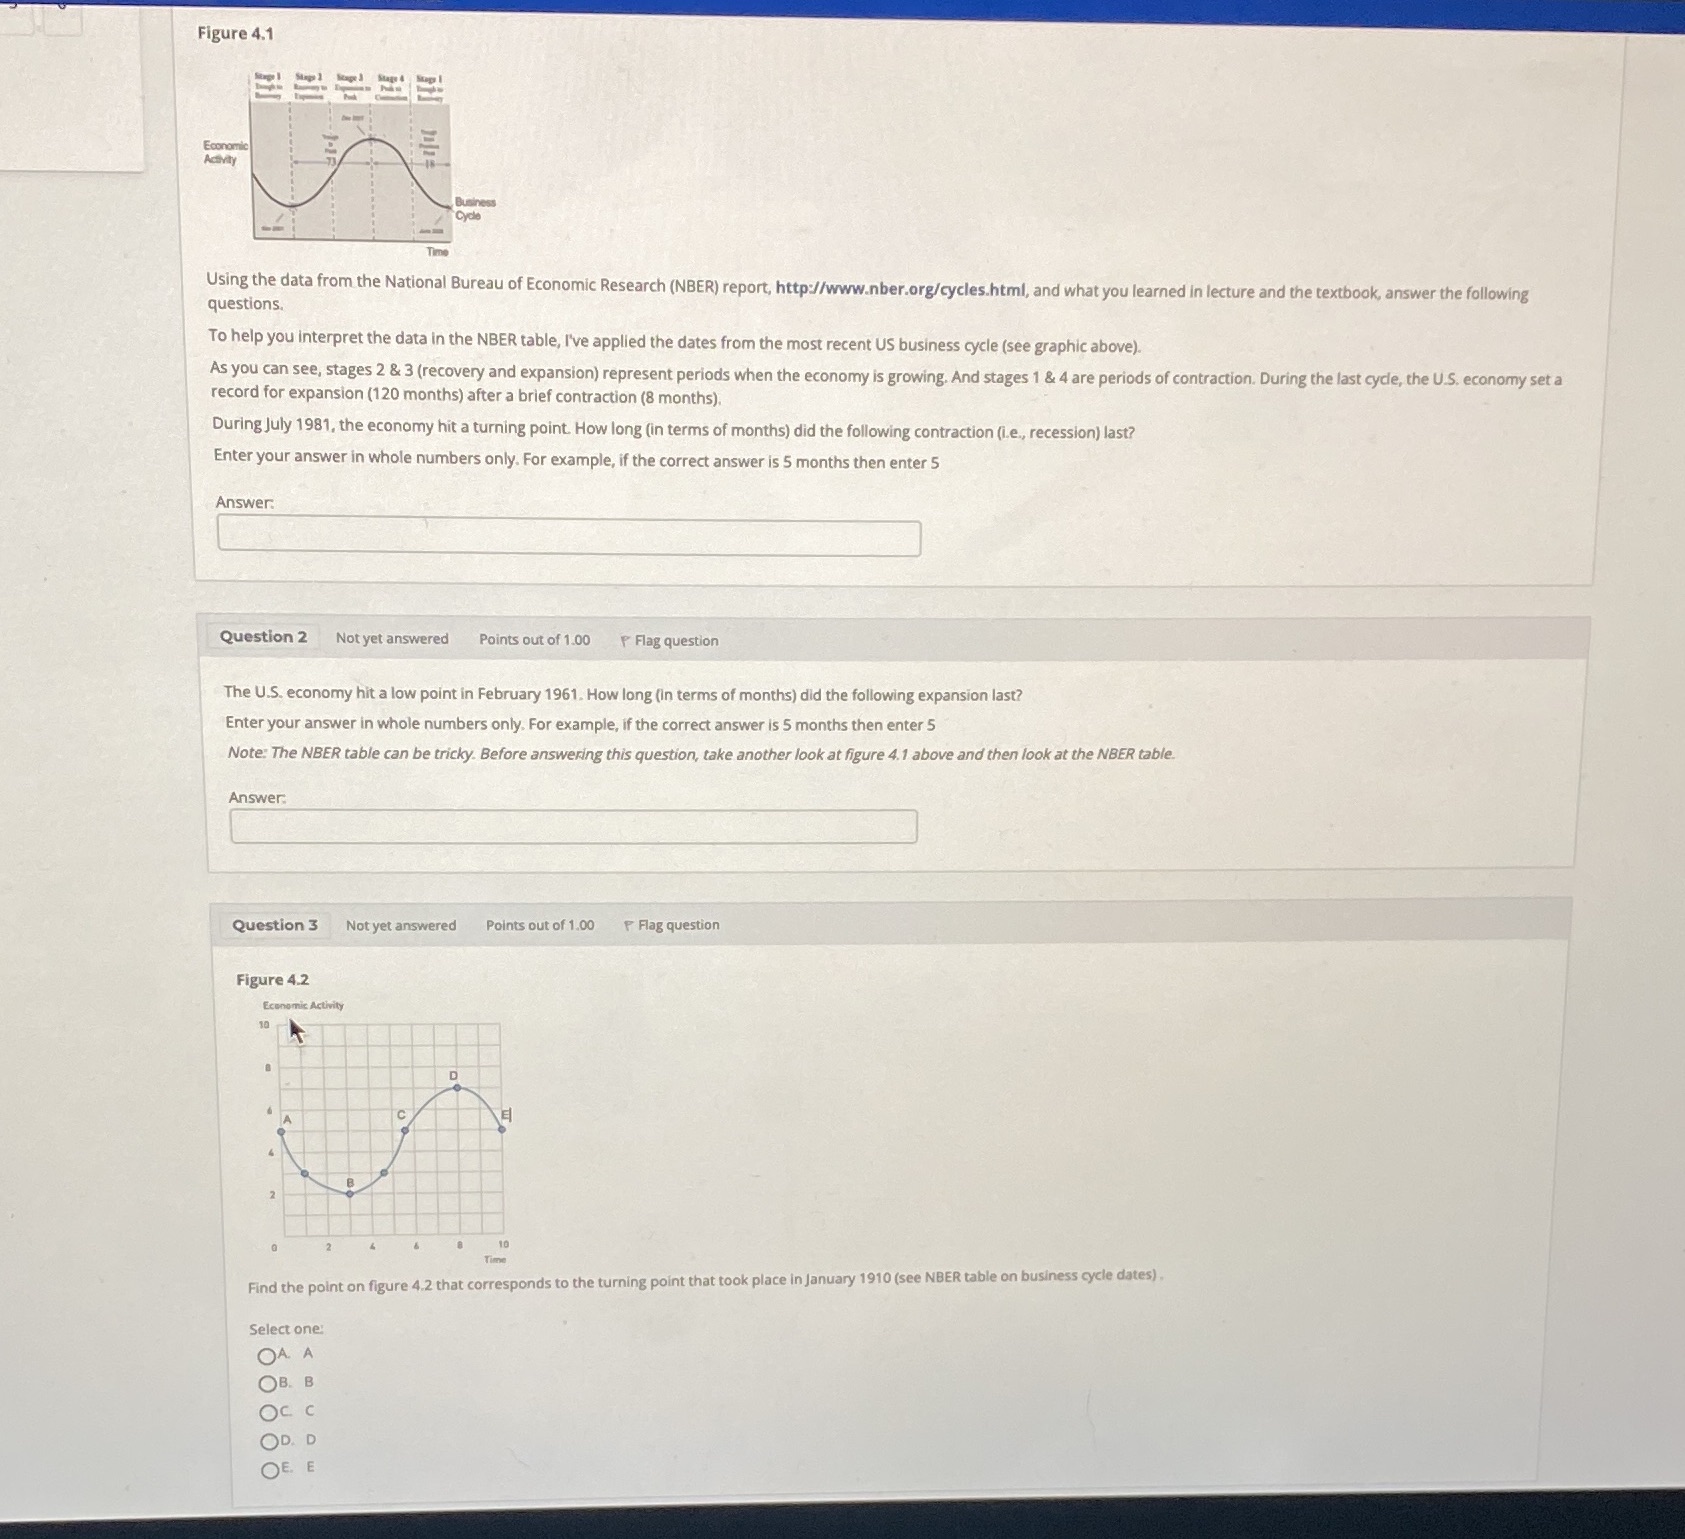
Figure 4.1 Econom E Using the data from the National Bureau of Economic Research (NBER) report, http://www.nber.org/cycles.html, and what you learned in lecture and the textbook, answer the following questions. To help you interpret the data in the NBER table, I've applied the dates from the most recent US business cycle (see graphic above). As you can see, stages 2 & 3 (recovery and expansion) represent periods when the economy is growing. And stages 1 & 4 are periods of contraction. During the last cycle, the U.S. economy set a record for expansion (120 months) after a brief contraction (8 months). During July 1981, the economy hit a turning point. How long (in terms of months) did the following contraction (i.e., recession) last? Enter your answer in whole numbers only. For example, if the correct answer is 5 months then enter 5 Answer. Question 2 Not yet answered Points out of 1.00 P Flag question The U.S. economy hit a low point in February 1961. How long (in terms of months) did the following expansion last? Enter your answer in whole numbers only. For example, if the correct answer is 5 months then enter 5 Note: The NBER table can be tricky. Before answering this question, take another look at figure 4.1 above and then look at the NBER table. Answer Question 3 Not yet answered Points out of 1.00 P Flag question Figure 4.2 Economic Activity Find the point on figure 4.2 that corresponds to the turning point that took place in January 1910 (see NBER table on business cycle dates) Select one: OA A OB. B Occ OD . D OE E
Step by Step Solution
There are 3 Steps involved in it

Get step-by-step solutions from verified subject matter experts