

Question: Figure 5-8. A demand curve is shown on the graph below. On the graph, Q represents quantity demanded and P represents price. Refer to Figure
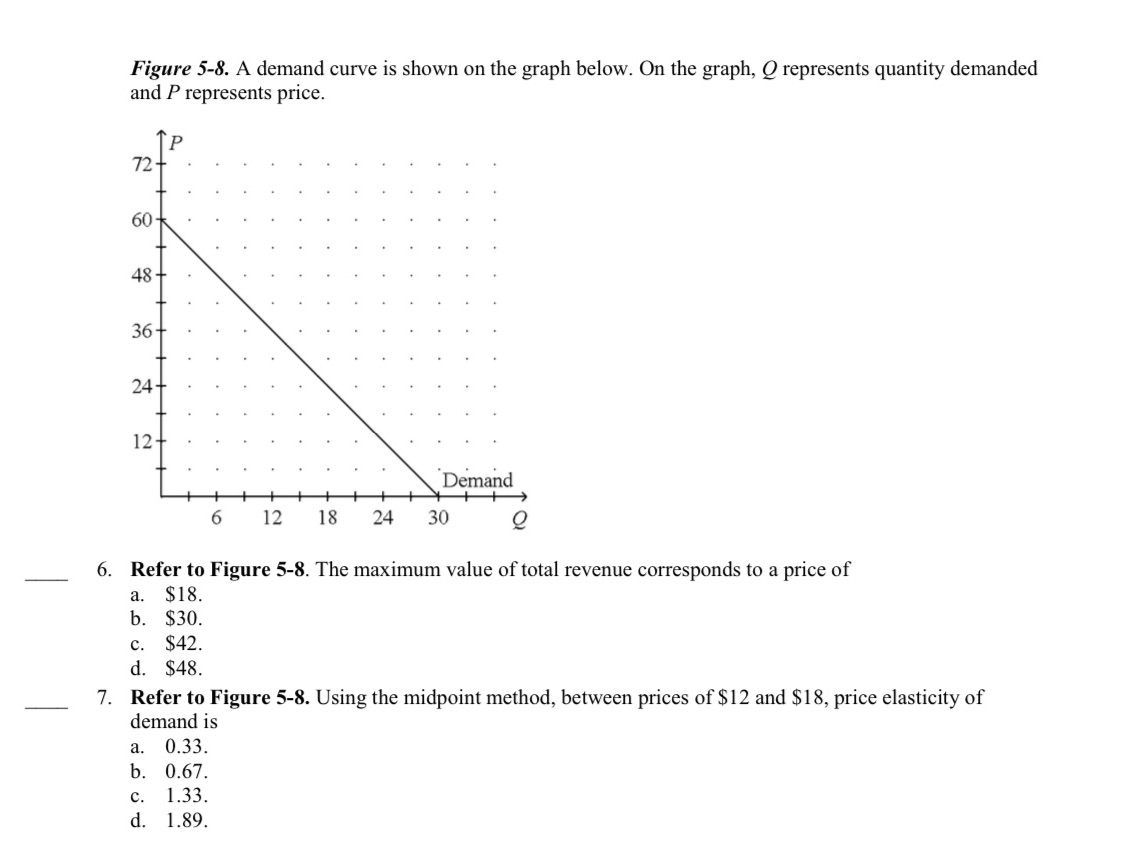
Figure 5-8. A demand curve is shown on the graph below. On the graph, Q represents quantity demanded and P represents price. Refer to Figure 5-8. The maximum value of total revenue corresponds to a price of a. $18. b. $30. c. $42. d. $48. Refer to Figure 5-8. Using the midpoint method, between prices of $12 and $18, price elasticity of demand is a. 0.33. b. 0.67. c. 1.33. d. 1.89
Step by Step Solution
There are 3 Steps involved in it
1 Expert Approved Answer
Step: 1 Unlock

Question Has Been Solved by an Expert!
Get step-by-step solutions from verified subject matter experts
Step: 2 Unlock
Step: 3 Unlock