

Question: FIGURE 6 . 3 AOA network from Figure 6 . 1 ( e ) with node labels added. table [ [ 4 , A
FIGURE AOA network from Figure e with node labels added.
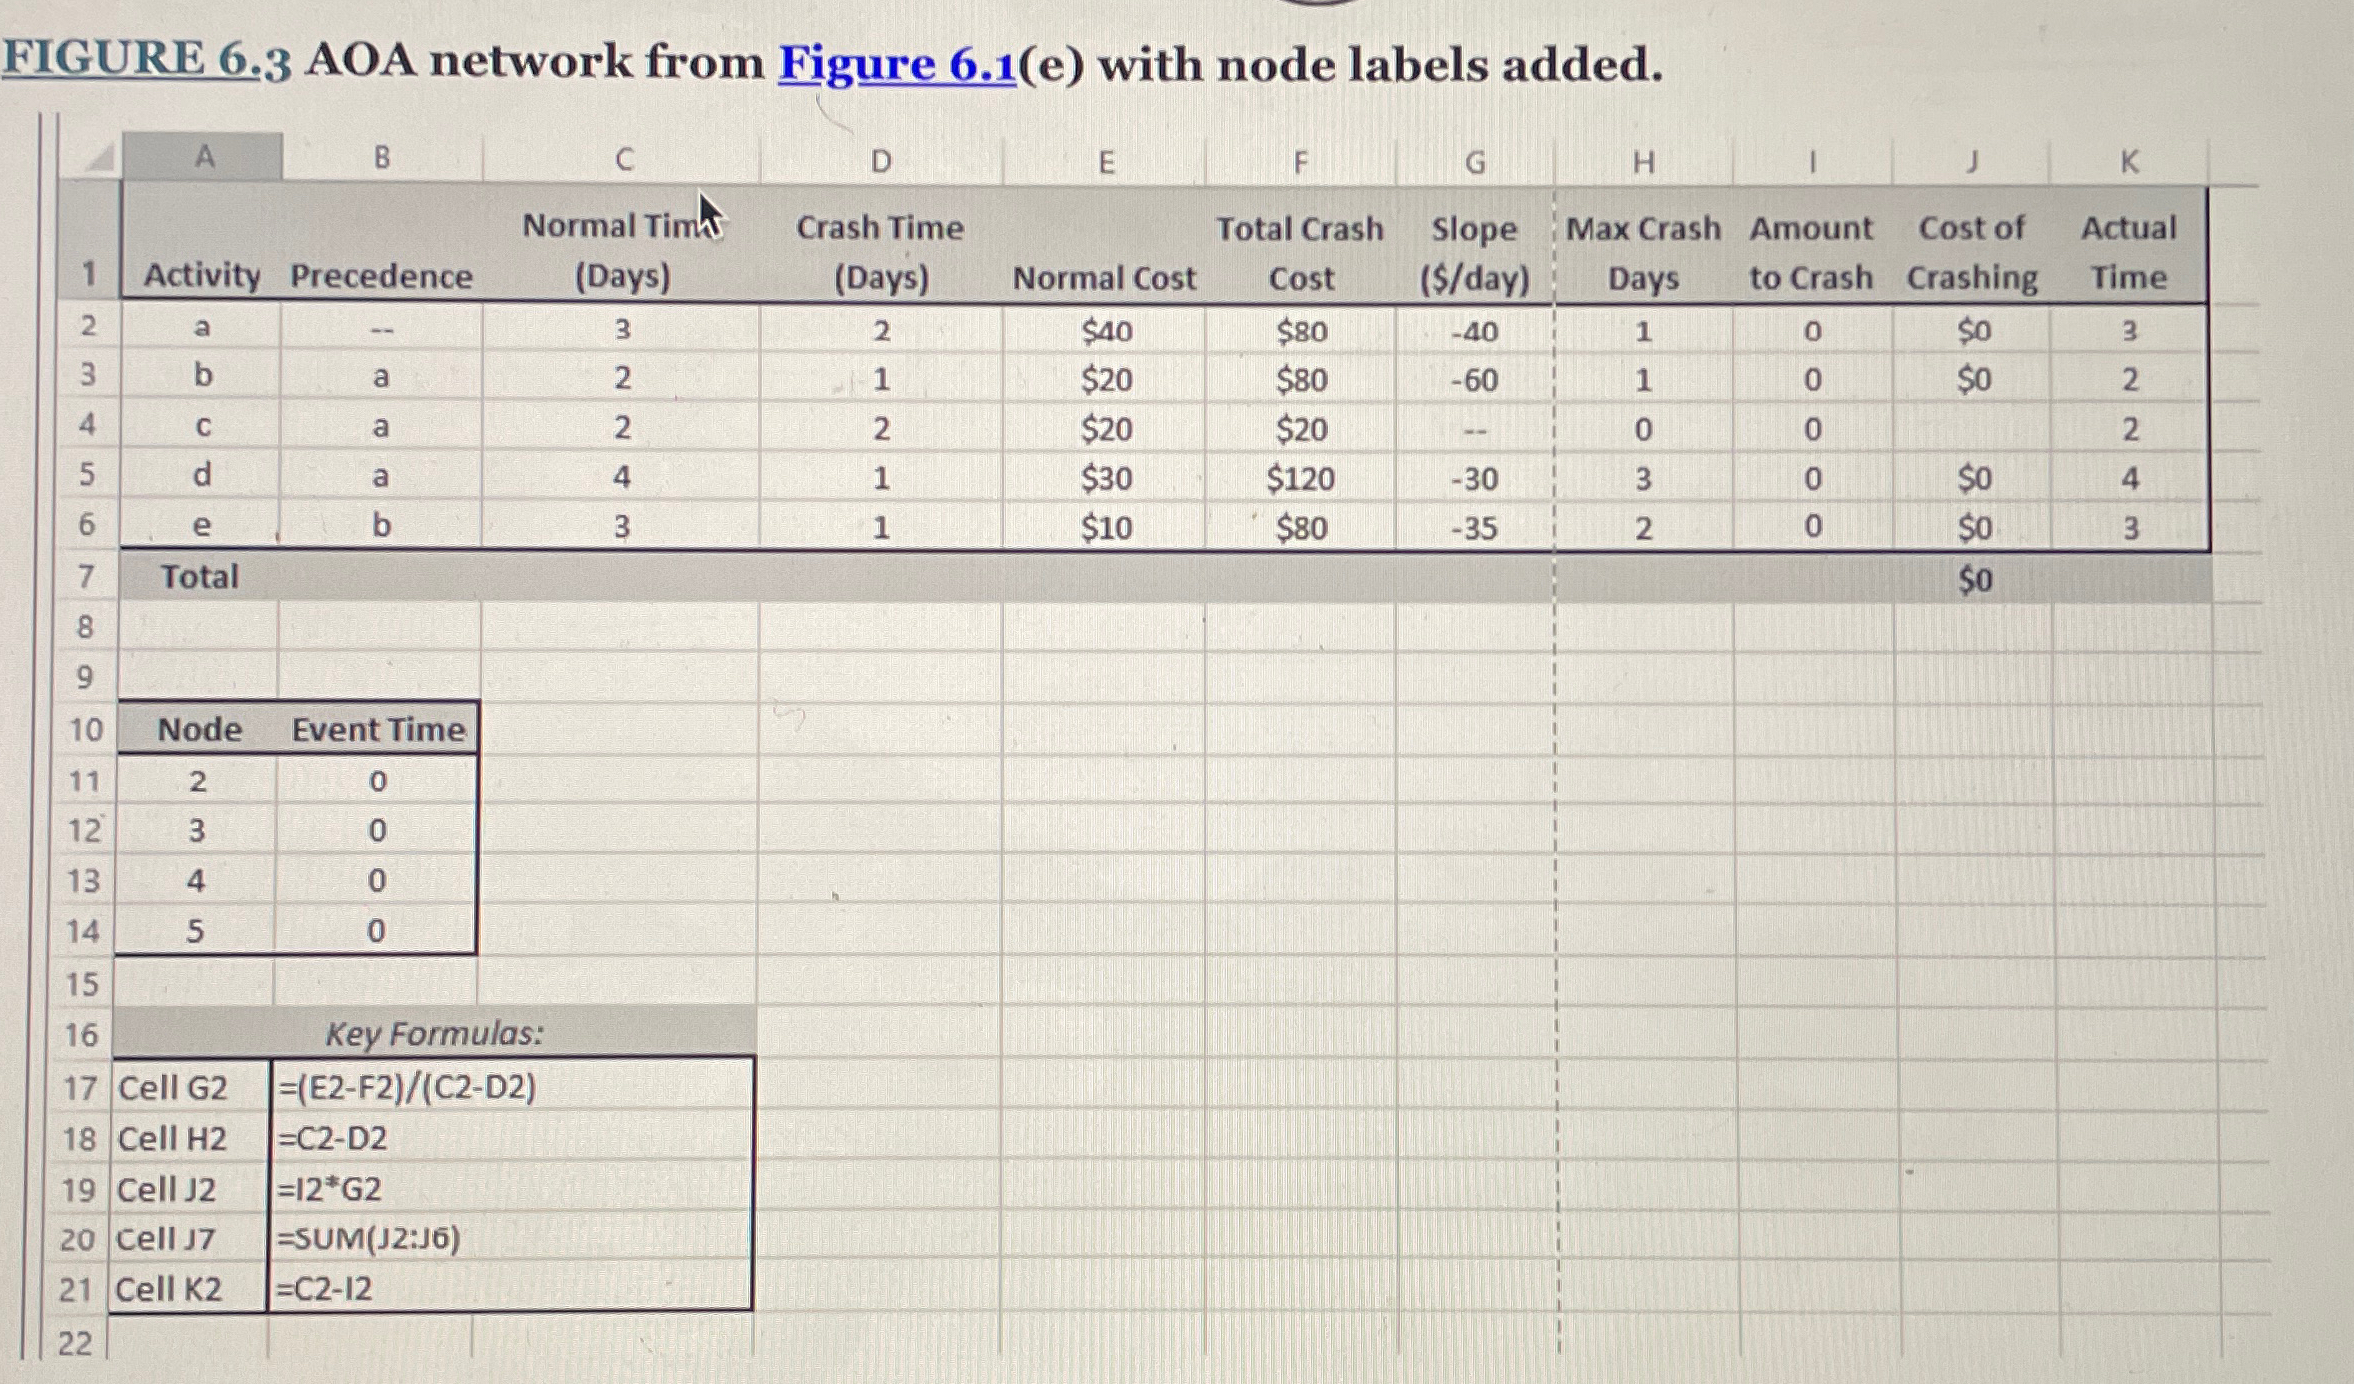
tableABCDEFGKActivity,Precedence,tableNormal TimetDaystableCrash TimeDaysNormal Cost,tableTotal CrashcosttableSlope$daytableMax CrashDaystableAmountto CrashtableCost ofCrashingtableActualTimea$$$ba$$$ca$$da$$$b$$$Total,,$Node,Event Time,,,,,,,,,Key Formulas:,,,,,,,,Cell GCell HCell JCell J:Cell K
Step by Step Solution
There are 3 Steps involved in it
1 Expert Approved Answer
Step: 1 Unlock

Question Has Been Solved by an Expert!
Get step-by-step solutions from verified subject matter experts
Step: 2 Unlock
Step: 3 Unlock