

Question: Figure 8 - 3 Price Level (1) (2) 115+ 110-+ A 100- (3) 4 46 Real GDP per Year (billions of dollars) Which point or

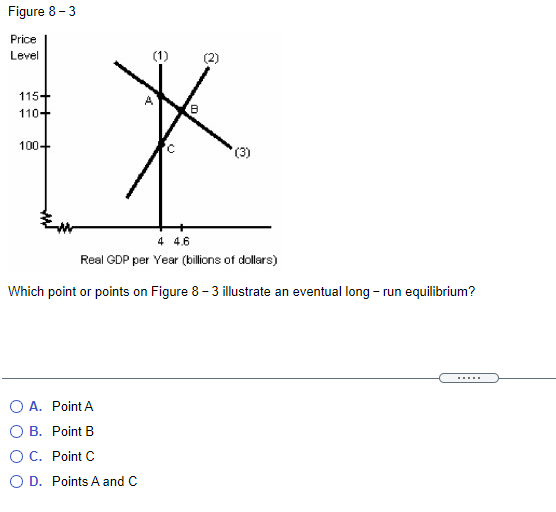
Figure 8 - 3 Price Level (1) (2) 115+ 110-+ A 100- (3) 4 46 Real GDP per Year (billions of dollars) Which point or points on Figure 8 - 3 illustrate an eventual long - run equilibrium? O A. Point A O B. Point B O C. Point C O D. Points A and C
Step by Step Solution
There are 3 Steps involved in it
1 Expert Approved Answer
Step: 1 Unlock

Question Has Been Solved by an Expert!
Get step-by-step solutions from verified subject matter experts
Step: 2 Unlock
Step: 3 Unlock