

Question: FIGURE 8.18 SENSITIVITY REPORT FOR THE QUALITY AIR CONDITIONING PROBLEM Refer to the sensitivity report in Figure 8.18. a. Identify the range of optimality for
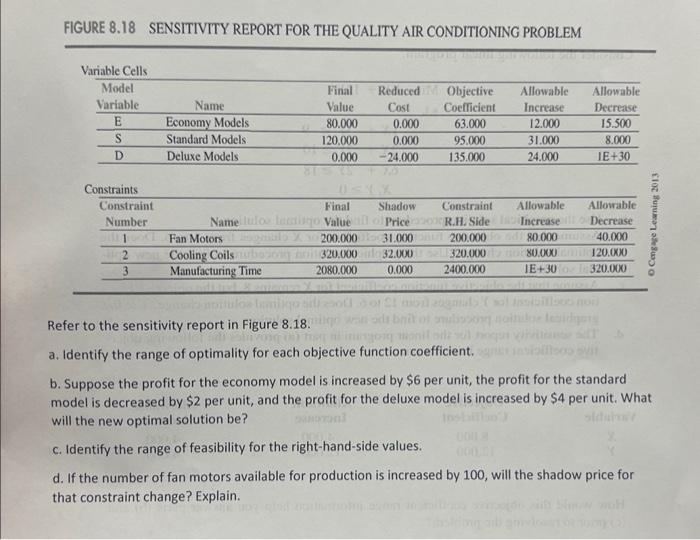
FIGURE 8.18 SENSITIVITY REPORT FOR THE QUALITY AIR CONDITIONING PROBLEM Refer to the sensitivity report in Figure 8.18. a. Identify the range of optimality for each objective function coefficient. b. Suppose the profit for the economy model is increased by $6 per unit, the profit for the standard model is decreased by $2 per unit, and the profit for the deluxe model is increased by $4 per unit. What will the new optimal solution be? c. Identify the range of feasibility for the right-hand-side values. d. If the number of fan motors available for production is increased by 100 , will the shadow price for that constraint change? Explain
Step by Step Solution
There are 3 Steps involved in it

Get step-by-step solutions from verified subject matter experts