

Question: Figure ( a ) shows plot of voltage across the capacitor as a function of the driving frequency for a sinusoidally driven electromagnetic oscillator LCR
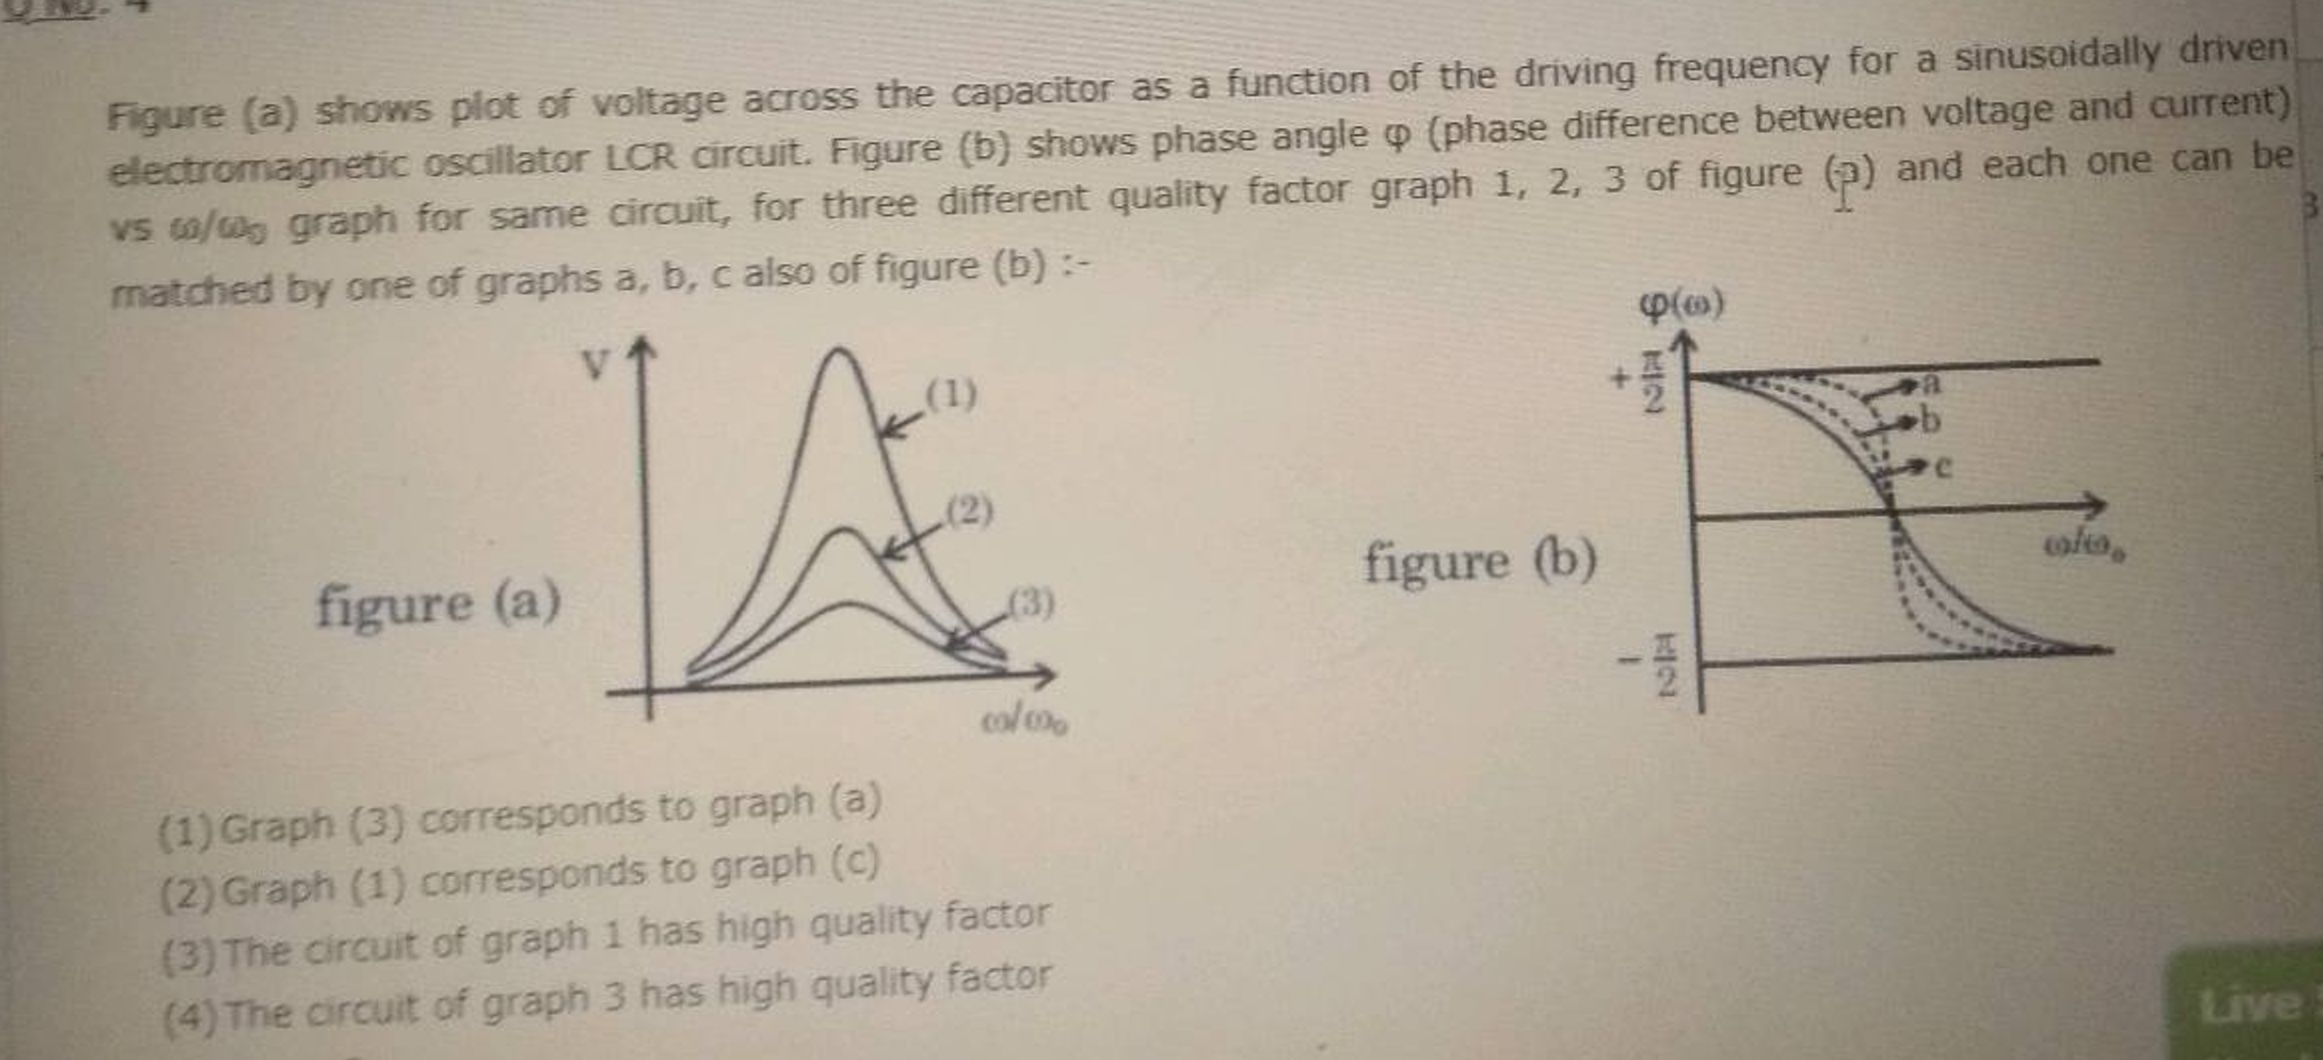
Figure a shows plot of voltage across the capacitor as a function of the driving frequency for a sinusoidally driven
electromagnetic oscillator LCR circuit. Figure b shows phase angle phase difference between voltage and current
vs graph for same circuit, for three different quality factor graph of figure and each one can be
matched by one of graphs a b c also of figure b :
Graph corresponds to graph a
Graph corresponds to graph c
The circuit of graph has high quality factor
The circuit of graph has high quality factor
Step by Step Solution
There are 3 Steps involved in it
1 Expert Approved Answer
Step: 1 Unlock

Question Has Been Solved by an Expert!
Get step-by-step solutions from verified subject matter experts
Step: 2 Unlock
Step: 3 Unlock