

Question: Figure E2. 11 x (m) C 40 B 30 FA D 20 10 E 0 1 2 3 4 5 6 7 8 9 10

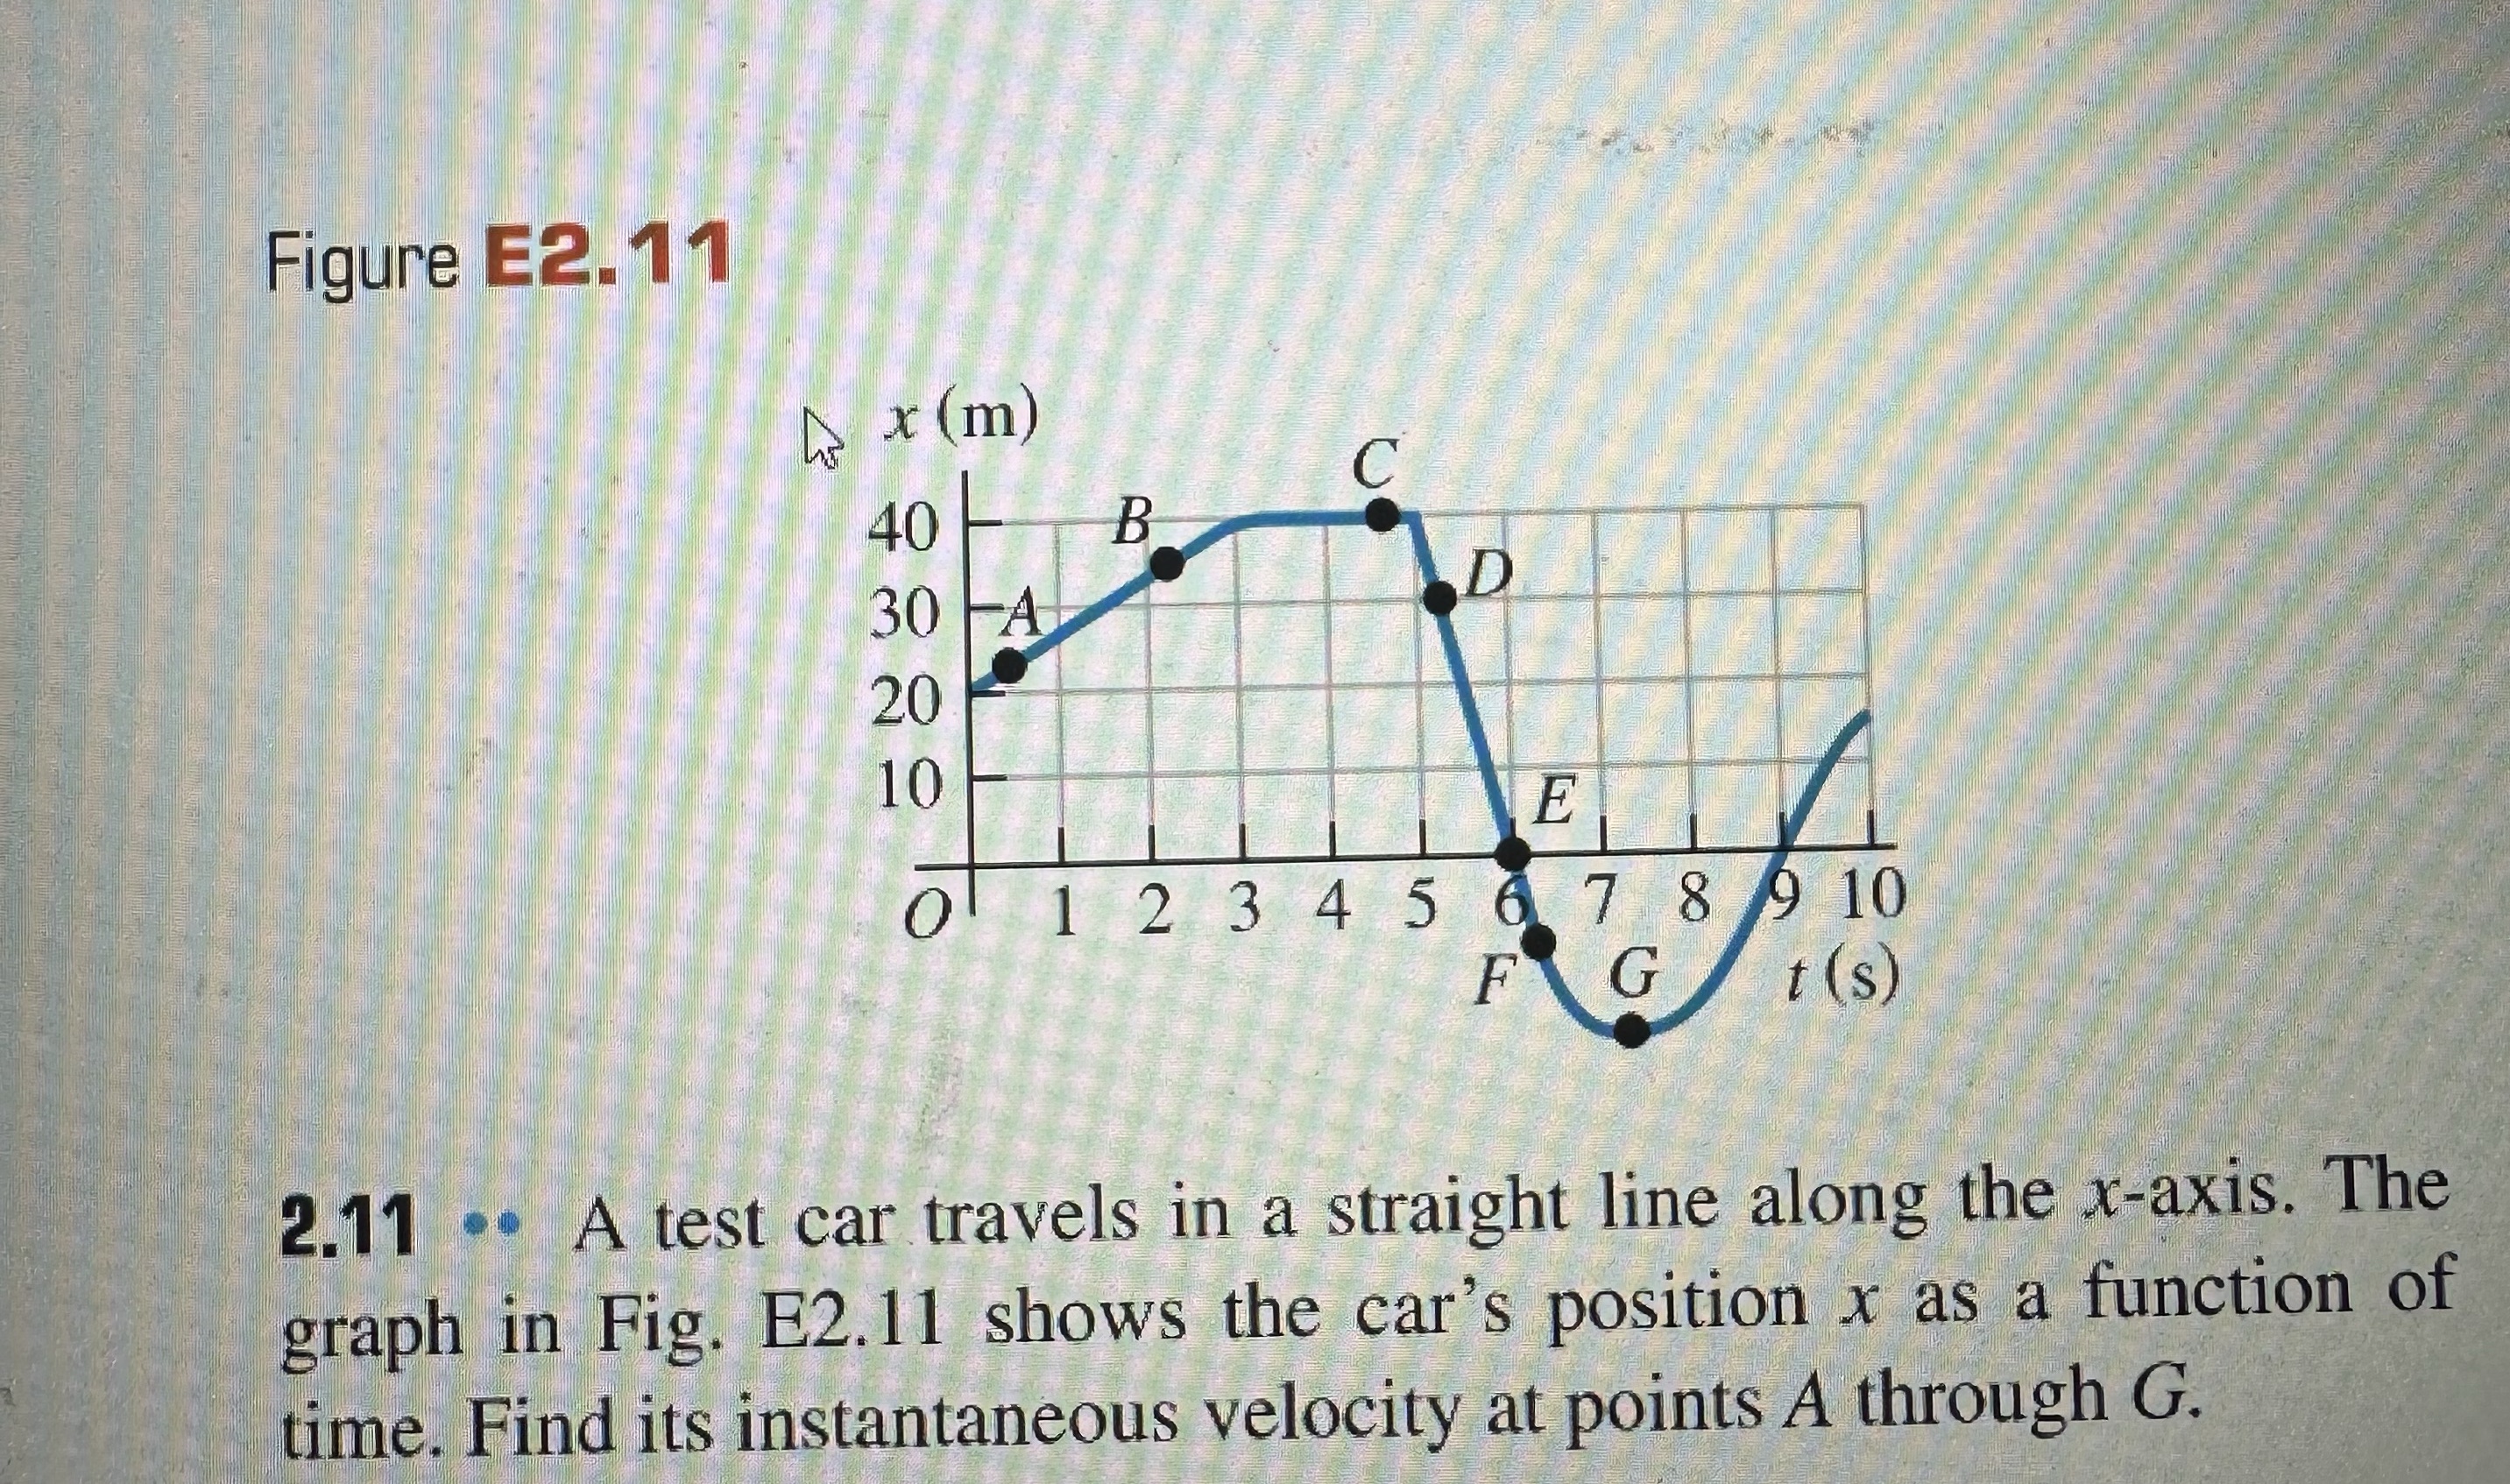
Figure E2. 11 x (m) C 40 B 30 FA D 20 10 E 0 1 2 3 4 5 6 7 8 9 10 F G t (s) 2.11 .. A test car travels in a straight line along the x-axis. The graph in Fig. E2.11 shows the car's position x as a function of time. Find its instantaneous velocity at points A through G
Step by Step Solution
There are 3 Steps involved in it
1 Expert Approved Answer
Step: 1 Unlock

Question Has Been Solved by an Expert!
Get step-by-step solutions from verified subject matter experts
Step: 2 Unlock
Step: 3 Unlock