

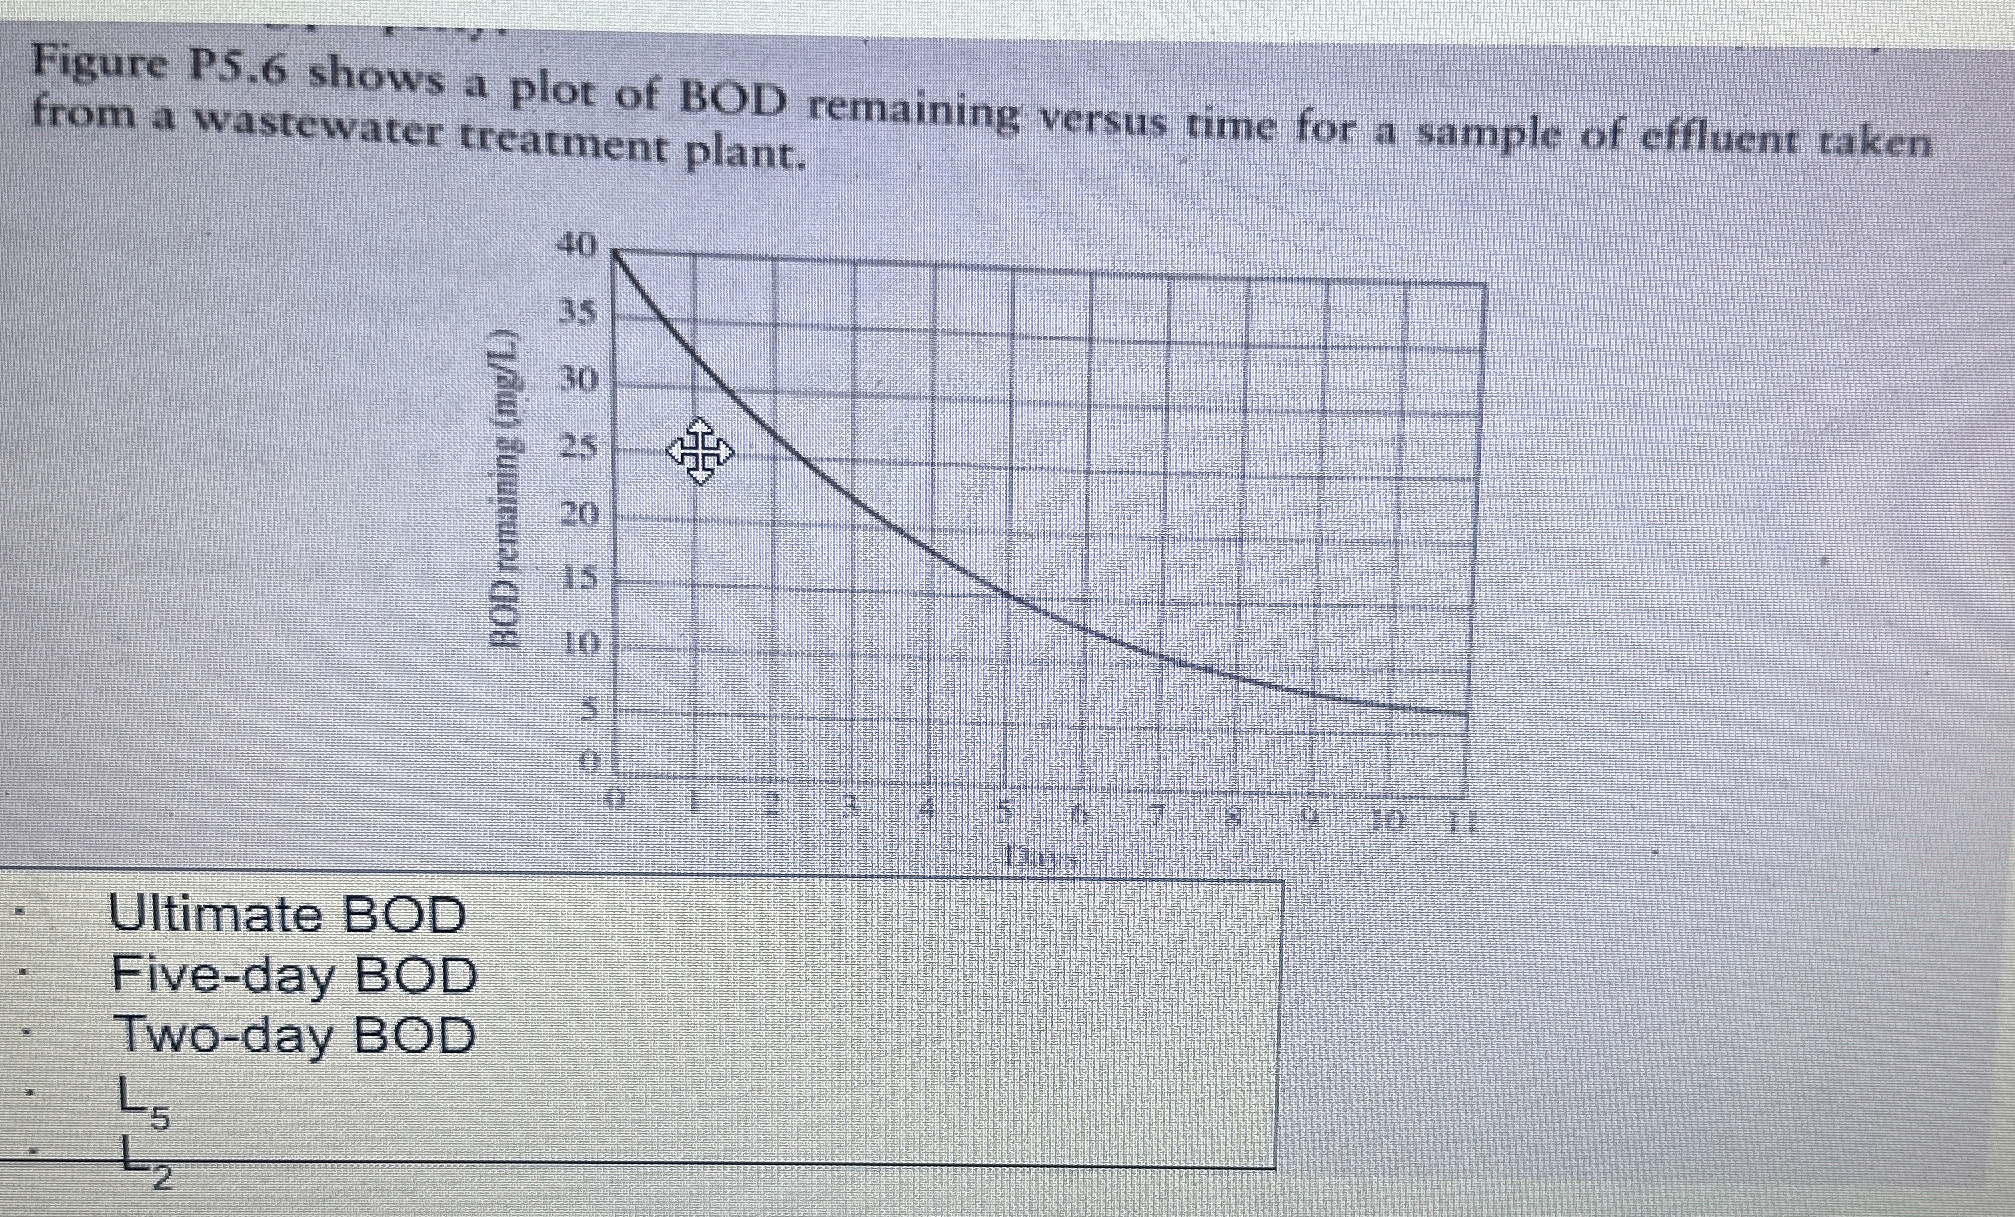
Question: Figure P 5 . 6 shows a plot of BOD remaining versus time for a sample of effluent taken from a wastewater treatment plant. Find
Figure P shows a plot of BOD remaining versus time for a sample of effluent taken
from a wastewater treatment plant. Find
Ultimate BOD
Fiveday BOD
Twoday BOD
Step by Step Solution
There are 3 Steps involved in it
1 Expert Approved Answer
Step: 1 Unlock

Question Has Been Solved by an Expert!
Get step-by-step solutions from verified subject matter experts
Step: 2 Unlock
Step: 3 Unlock