

Question: Figure P5.6 shows a plot of BOD remaining versus time for a sample of effluent taken from a wastewater treatment plant. (a) What is the
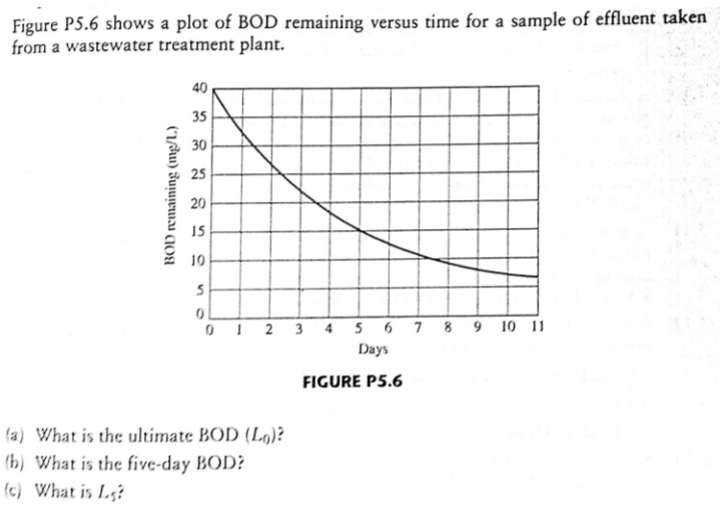
Figure P5.6 shows a plot of BOD remaining versus time for a sample of effluent taken from a wastewater treatment plant. (a) What is the ultimate BOD(L0) ? (b) What is the five-day BOD? (c) What is L.s
Step by Step Solution
There are 3 Steps involved in it
1 Expert Approved Answer
Step: 1 Unlock

Question Has Been Solved by an Expert!
Get step-by-step solutions from verified subject matter experts
Step: 2 Unlock
Step: 3 Unlock