

Question: Figures A, B, and C, below, show demand and supply curves in three competitive markets. a. In each figure, label the competitive equilibrium price

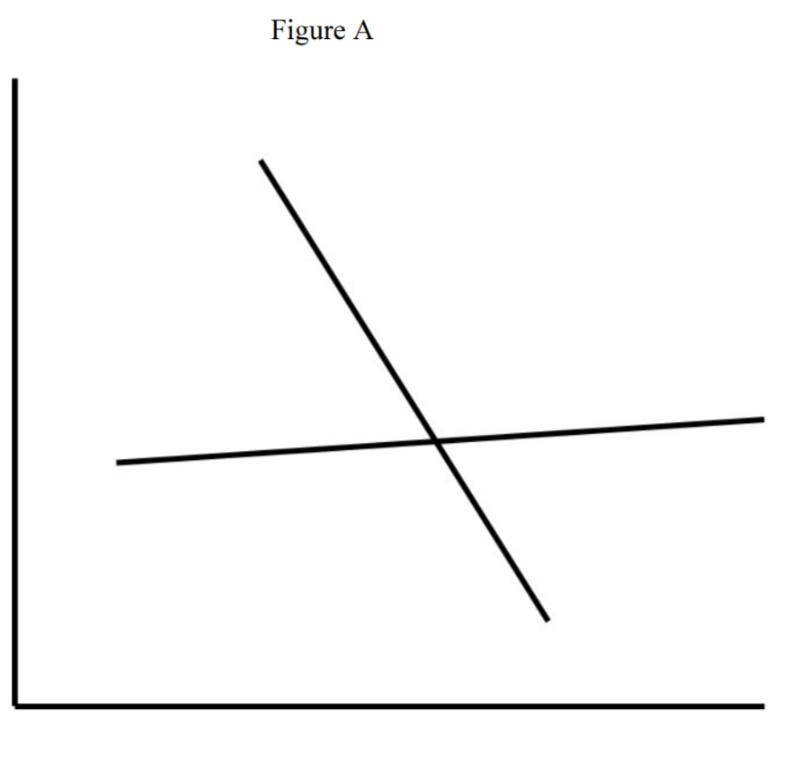
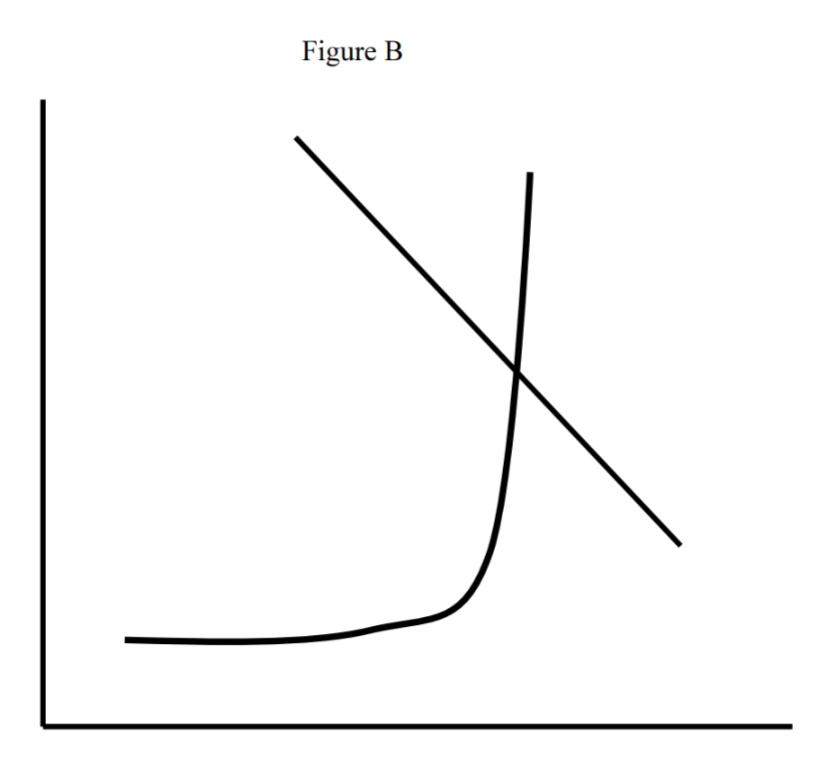
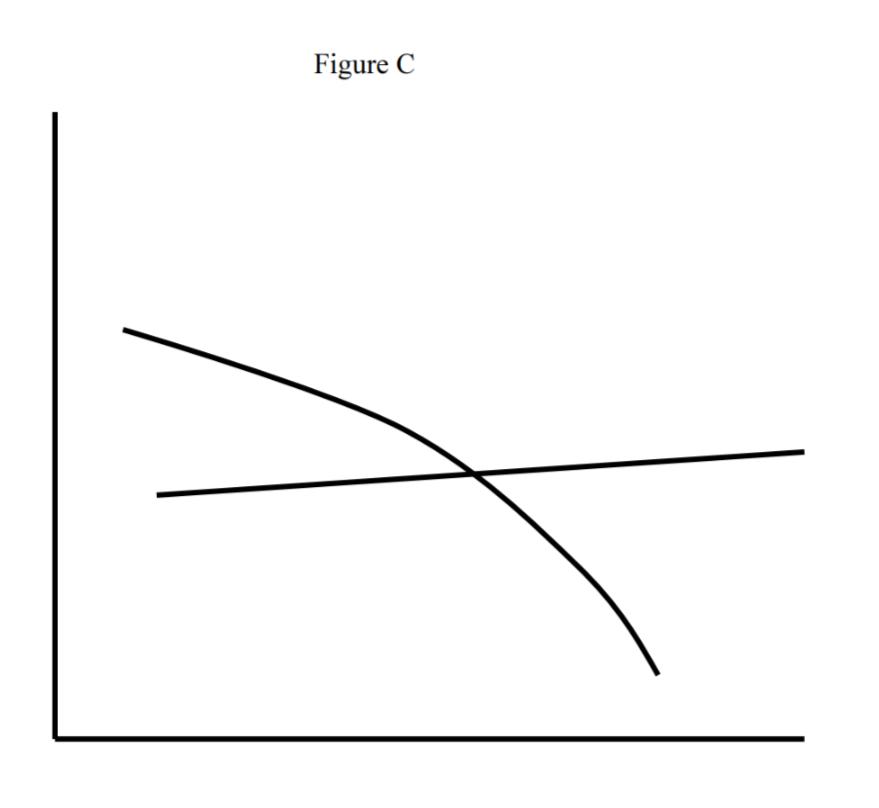
Figures A, B, and C, below, show demand and supply curves in three competitive markets. a. In each figure, label the competitive equilibrium price and quantity traded on the appropriate axes. b. Suppose that a unit tax is imposed on the sellers in each of the three markets. The tax in each market equals 1/3 of the competitive equilibrium price in part a. In each graph, show the effect of the tax on the quantity traded and on the effective (after-tax) prices for the buyers and sellers. c. In each figure, determine which side of the market, buyers or sellers bears the bigger fraction of the tax burden in part b? Explain what it is about that market that accounts for this distribution of the tax burdens. d. In each figure, show an area that equals the deadweight loss (DWL) from the tax, assuming that there is no marginal damage. Estimate the ratio: DWL (tax revenue). Which market has the highest of these deadweight loss ratios? What is it about that market that makes it have the highest deadweight loss ratio? e. For each of the following real markets, which Figure, A, B or C, probably comes closest to representing its demand and supply curves: (el) the market for hotel rooms in a big US city that is a popular tourist attraction during a summer season. (e2) the US retail market for nonsteroid anti-inflammatory drugs (Motrin, Advil, Ibuprofen) during a two year period; (e3) the market for organic avocados sold in the US in the last two years? Note: Organic avocados, unlike nonorganics, are grown without pesticides. Many organic and nonorganic avocados sold in the US are imported from Latin America. Explain what this information tells us about the likely shapes of supply and demand curves for organic avocados. Figure A Figure B Figure C Figures A, B, and C, below, show demand and supply curves in three competitive markets. a. In each figure, label the competitive equilibrium price and quantity traded on the appropriate axes. b. Suppose that a unit tax is imposed on the sellers in each of the three markets. The tax in each market equals 1/3 of the competitive equilibrium price in part a. In each graph, show the effect of the tax on the quantity traded and on the effective (after-tax) prices for the buyers and sellers. c. In each figure, determine which side of the market, buyers or sellers bears the bigger fraction of the tax burden in part b? Explain what it is about that market that accounts for this distribution of the tax burdens. d. In each figure, show an area that equals the deadweight loss (DWL) from the tax, assuming that there is no marginal damage. Estimate the ratio: DWL (tax revenue). Which market has the highest of these deadweight loss ratios? What is it about that market that makes it have the highest deadweight loss ratio? e. For each of the following real markets, which Figure, A, B or C, probably comes closest to representing its demand and supply curves: (el) the market for hotel rooms in a big US city that is a popular tourist attraction during a summer season. (e2) the US retail market for nonsteroid anti-inflammatory drugs (Motrin, Advil, Ibuprofen) during a two year period; (e3) the market for organic avocados sold in the US in the last two years? Note: Organic avocados, unlike nonorganics, are grown without pesticides. Many organic and nonorganic avocados sold in the US are imported from Latin America. Explain what this information tells us about the likely shapes of supply and demand curves for organic avocados. Figure A Figure B Figure C
Step by Step Solution
3.40 Rating (163 Votes )
There are 3 Steps involved in it
D S P ff 5 O BE SE 5 t SE s DA Tax imposed on serie It incurases the ... View full answer

Get step-by-step solutions from verified subject matter experts