

Question: File Edit View Insert Format Tools Table Window Help G AutoSave OnA CG FF ... W. Final Exam Spring 2024 - Saved to my Mac
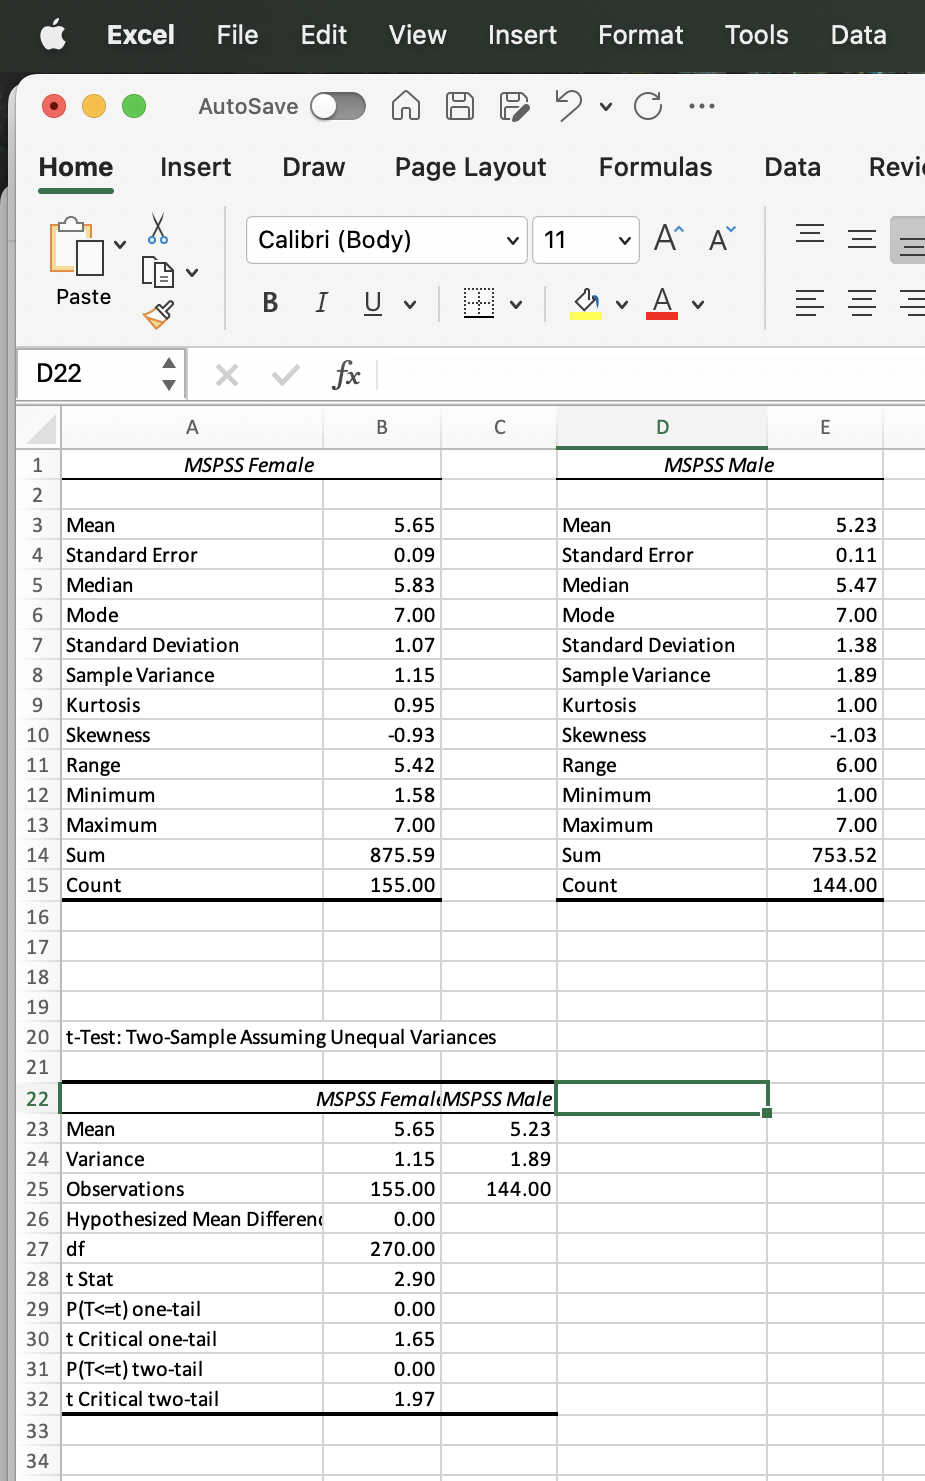
File Edit View Insert Format Tools Table Window Help G AutoSave OnA CG FF ... W. Final Exam Spring 2024 - Saved to my Mac v Q Insert Draw Design Layout References Mailings >> Tell me Comments Editing v Share Cambria 24 A" A Aav E IEv BI Uvab X X|A DAY Styles Styles Dictate Add-ins Editor Pane Excel Instructions: t-test Use the Data Analysis toolpak to generate descriptive statistics tables for the Female and Male columns of data for the MSPSS variable in the t-test dataset. Then conduct a two- sample t-test assuming unequal variances using the Female and Male MSPSS data columns. Place the descriptive statistics tables and the t-test results in the spreadsheet labeled "t-test results." Make sure all numbers are set to 2 decimal places. T-test Questions (2 points each) 1. What is the null hypothesis for this test (verbal only)? Assume a two-tailed test. N What is the alternative hypothesis (verbal only)? 3. What are the assumptions for this particular t-test, and does your data meet them? You will run the test regardless of whether your data meet the assumptions. 4. Write up the results of your t-test. Be sure to state the test you ran, the test statistic, degrees of freedom, p-value, whether or not it was significant, the group means and standard deviations, and make sure you draw a conclusion that makes sense of the results (which group scored higher or lower?). (14 points)Excel File Edit View Insert Format Tools Data O AutoSave A P Y C... Home Insert Draw Page Layout Formulas Data Revi Calibri (Body) 11 A A Paste BIUV V VA D22 X V fx A B C D E MSPSS Female MSPSS Male IN W Mean 5.65 Mean 5.23 4 Standard Error 0.09 Standard Error 0.11 5 Median 5.83 Median 5.47 6 Mode 7.00 Mode 7.00 7 Standard Deviation 1.07 Standard Deviation 1.38 8 Sample Variance 1.15 Sample Variance 1.89 9 Kurtosis 0.95 Kurtosis 1.00 10 Skewness -0.93 Skewness -1.03 11 Range 5.42 Range 6.00 12 Minimum 1.58 Minimum 1.00 13 Maximum 7.00 Maximum 7.00 14 Sum 875.59 Sum 753.52 15 Count 155.00 Count 144.00 16 17 18 19 20 t-Test: Two-Sample Assuming Unequal Variances 21 22 MSPSS FemaleMSPSS Male 23 Mean 5.65 5.23 24 Variance 1.15 1.89 25 Observations 155.00 144.00 26 Hypothesized Mean Different 0.00 27 df 270.00 28 t Stat 2.90 29 P(T
Step by Step Solution
There are 3 Steps involved in it

Get step-by-step solutions from verified subject matter experts