Question: File Home Chap006-SPC-1/21 saved Incert formes Data View Help teme what you want to Do Openis Deo Marsh Shah Connection Connect Con IN YOU Stec
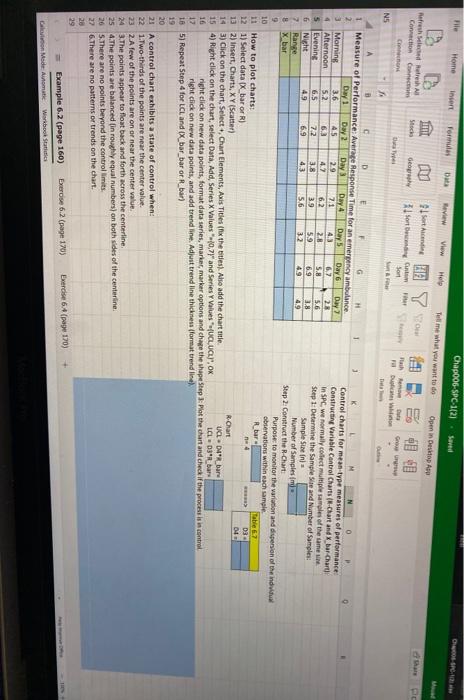
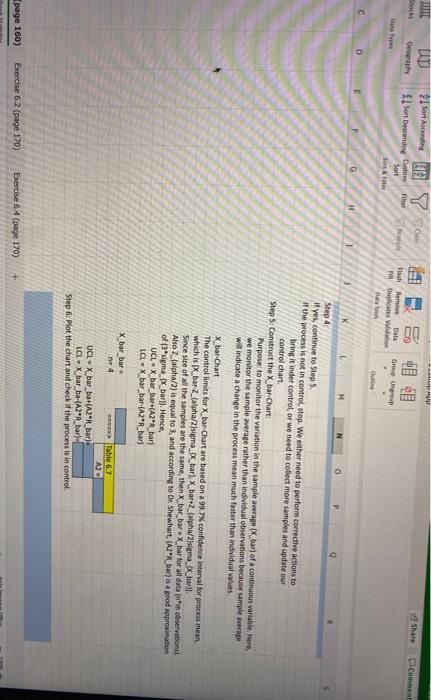
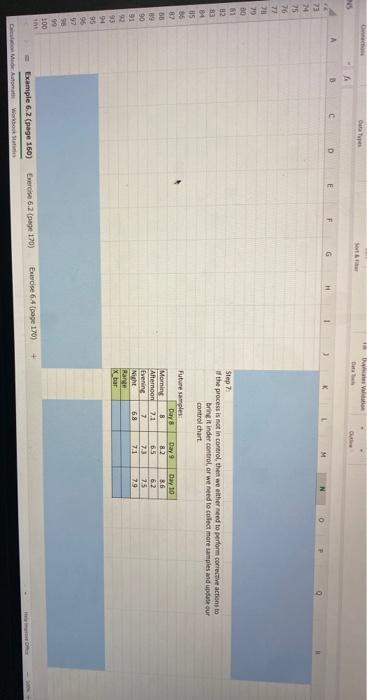
File Home Chap006-SPC-1/21 saved Incert formes Data View Help teme what you want to Do Openis Deo Marsh Shah Connection Connect Con IN YOU Stec Sortie 1 sort to Sort Ger Hah Duba NS 1 Day 1 D E G Measure of Performance: Average Response Time for an emergency ambulance 1 2 Day 2 0 Day Day 4 Control charts for mean-type measures of performance 3 Morning Day 5 Oay 6 Day 7 3.6 45 2.9 Constructing Variable Control Charts (-Chart and X bar-Chart 71 4.3 Afternoon 6,2 23 4 5.2 6.3 4.2 6.2 in SPC, we normally collect multiple samples of the same 2.8 5 Evening S. 5.6 6.5 7.2 Step 1: Determine the Sample Site and Number of Samples 3.8 3.9 59 6.9 28 G Night 4.9 69 4.3 5.6 Sample Sin 32 49 49 7 Range Number of Samples 8 X bar Step 2: Construct the R-Chart: Purpose to monitor the variation and dispersion of the individu 9 observations within each sample 10 R_bar 11 How to plot charts: na 4 03 121) Select data IX bar or R) 04 13 2) insert, Charts, XY Scutter) R Chart 14 3) Click on the chart, Select, Chart Elements, Axis Titles (fix the titles). Also add the chart mitte UCLDR bare 154) Right click on the chart, select Data, Add, Series X Values 0.79" and Series Y Values UCL, UCHI", OK LCLOR bar 16 right click on new data points, format data series, marker, marker options and chape the shape Step at the chant and check if the process is in control 12 right click on new data points, and add trendline. Adjust trendline thickness (format trendline 18 5) Repeat Step 4 for LCL and (x_bar_bar or Rebar) 19 20 21 A control chart exhibits a state of control when: 22 1.Two-thirds of the points are near the center value. 23 2.A few of the points are on or near the center value 24 3. The points appear to float back and forth across the centerline 25 4. The points are balanced in roughly equal numbers) on both sides of the centerline 26 S.There are no points beyond the controllimits 27 6.There are no patterns or trends on the chart. 20 Exercise 6:4 (page 170) Exercise 6.2 (page 1705 Example 6.2 (page 160) Galon Mode Automatic Workbook LUT Geography Sort Ascendine 27 1 Sort Descending Custom Stock comme Bath Remove Date GU Dulces in C G H K P Step 4 If yes, continue to Step 5. if the process is not in control, stop. We either need to perform corrective actions to bring it inder control or we need to collect more samples and update our control chart. Step 5: Construct the X bar-Chart: Purpose to monitor the variation in the sample average_bart of a continuous variable. Here, we monitor the sample average rather than individual observations because sample weape will indicate a change in the process mean much faster than individual values X bar Chart The controllimits for X bar-Chart are based on a 99.7% confidence interval for process mean which is IX_bar Zalpha/2sigma__bar). X bar+2_falpha/2sigma_x_all Since size of all the samples are the same, then X_bar_bare X_bar for all data (nm observations) Also 2 (alpha/2) is equal to 3, and according to Dr Shewhart, (AZ"R_bar) is a good approximation of p*sigma_x_bary). Hence, UCL - X_bar_bar+(A2"_bar) LCLX_bar_bar-(A2'R_bar) X bar bar na 4 > Table 62 A2 UCL - X bar ba+(A2R bar) LCL - X bar ba-(A2PR bara Step 6: Plot the chart and check the process is in control (page 160) Exercise 6.2 (page 170) Exercise 64 (page 170) + Barap Sort Dual 4 F F G H 23 74 25 76 77 78 70 83 Step 7 the process is not in control, then we either need to perform corrective actions to bring it inder control or weed to collect more samples and update our control chart 36 82 Morning Future samples Days 8 Afternoon 2.1 Evening Nicht 68 Rand X bar Days 82 5 7.5 71 Day 10 36 62 75 7.9 19 90 91 92 93 94 95 96 90 100 Exercise 6.2 (page 170) Bude 64 page 170) Example 6.2 (page 160) Die Auto Wom