

Question: thats all the information i have Excel: Graded Tutorial #1 What is the square root of the sample size (unrounded)? 3.317 What is the value
thats all the information i have
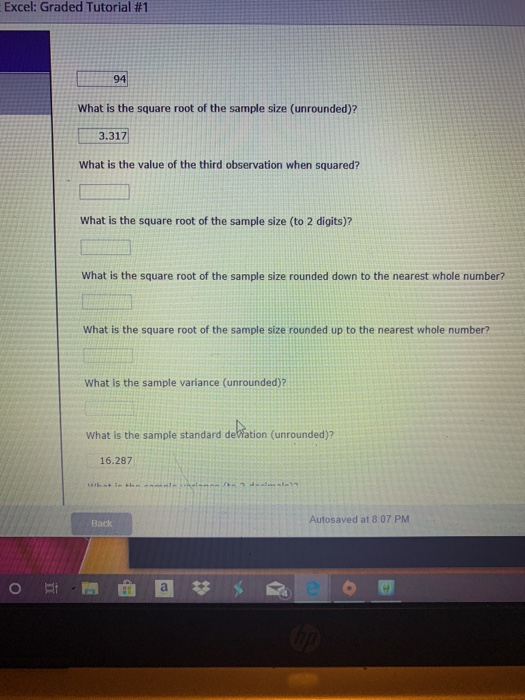
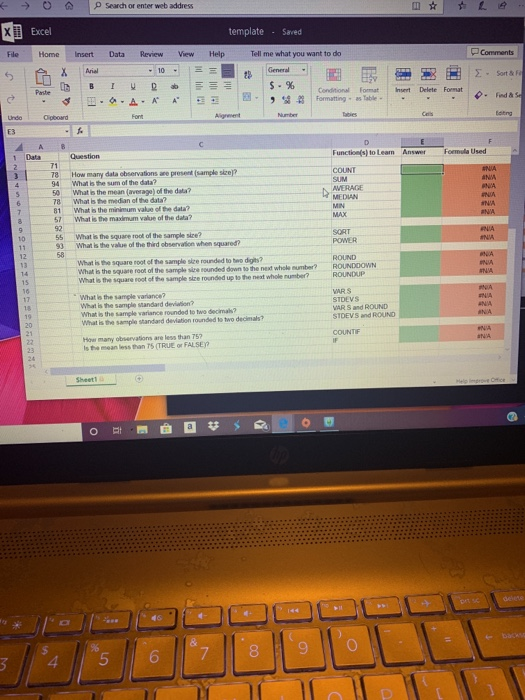
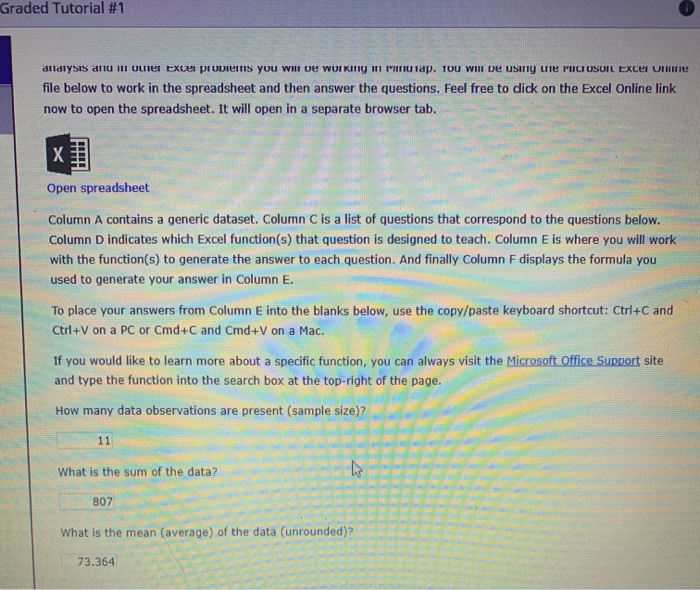
Excel: Graded Tutorial #1 What is the square root of the sample size (unrounded)? 3.317 What is the value of the third observation when squared? What is the square root of the sample size (to 2 digits)? What is the square root of the sample size rounded down to the nearest whole number? What is the square root of the sample size rounded up to the nearest whole number? What is the sample variance (unrounded)? What is the sample standard debation (unrounded)? 16.287 Back Autosaved at 8:07 PM 2 Search or enter web address 0 X] Excel File Home template - Saved Insert View Help 3 = Tell me what you want to do > General S a Data Review - 10 UD A. A Font Comments Santa set Delete Formato da LU i l Formatting format c E . Clipboard Question Function(s) to Leam Answer SUM 94 50 AVERAGE How many data observations are present sample size? What is the sum of the data? What is the mean (average of the data? What is the median of the data? What is the minimum value of the data? What is the maximum value of the data? MEDIAN MAX 57 55 What is the square root of the sample sice? What is the value of the third observation whenuared? POWER What is the square root of the sample see rounded to the digits? What is the square root of the samples rounded down to the next whole number? What is the square foot of the sample size rounded up to the next whole number? ROUND ROUNDDOWN ROUNDUP STDEVS VAR S and ROUND SIDEV S and ROUND NINH What is the sample variance? What is the sample Mandard devion? What is the sample variance Founded to two decimals? What is the sample standard deviation founded to two decimals? How many bervations are less than 75 Is the mean less than 75 (TRUE FALSEY COUNTIF 3 11 Graded Tutorial #1 analysis an illuuier Excel problems you will be wUIKIIG I MITU Tap. Tou will be using uie MICI USOIL Excel Uruire file below to work in the spreadsheet and then answer the questions. Feel free to dick on the Excel Online link now to open the spreadsheet. It will open in a separate browser tab Open spreadsheet Column A contains a generic dataset. Column C is a list of questions that correspond to the questions below. Column D indicates which Excel function(s) that question is designed to teach. Column E is where you will work with the function(s) to generate the answer to each question. And finally Column F displays the formula you used to generate your answer in Column E. To place your answers from Column E into the blanks below, use the copy/paste keyboard shortcut: Ctrl+C and Ctrl+V on a PC or Cmd+C and Cmd+V on a Mac. If you would like to learn more about a specific function, you can always visit the Microsoft Office Support site and type the function into the search box at the top-right of the page. How many data observations are present (sample size)? What is the sum of the data? 807 What is the mean (average) of the data (unrounded)? e data com 73.364 Step by Step Solution
There are 3 Steps involved in it
1 Expert Approved Answer
Step: 1 Unlock

Question Has Been Solved by an Expert!
Get step-by-step solutions from verified subject matter experts
Step: 2 Unlock
Step: 3 Unlock