

Question: File Home Insert Draw Page Layout Formulas Data Calibri 11 ' ' == Paste BIU A Clipboard Font Alignme POSSIBLE DATA LOSS Some features might
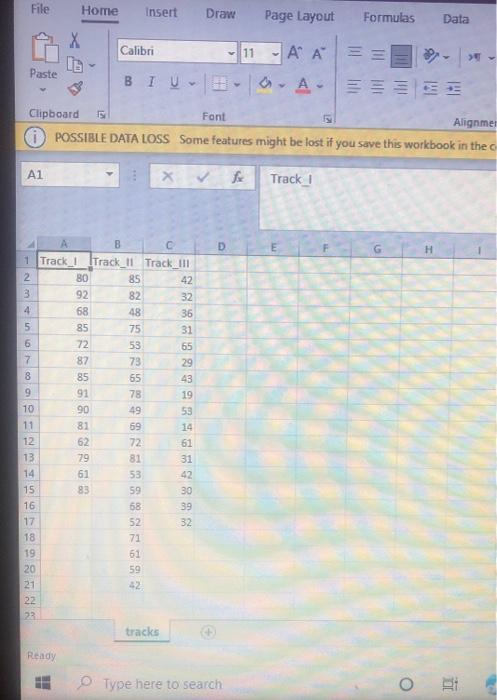
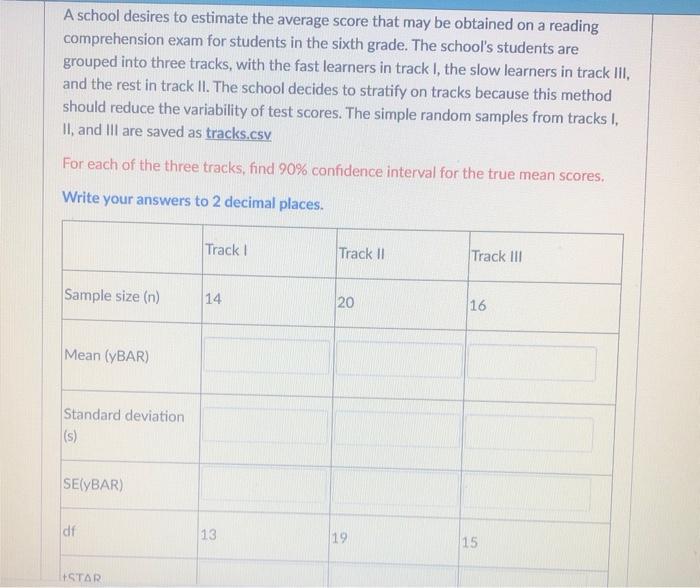
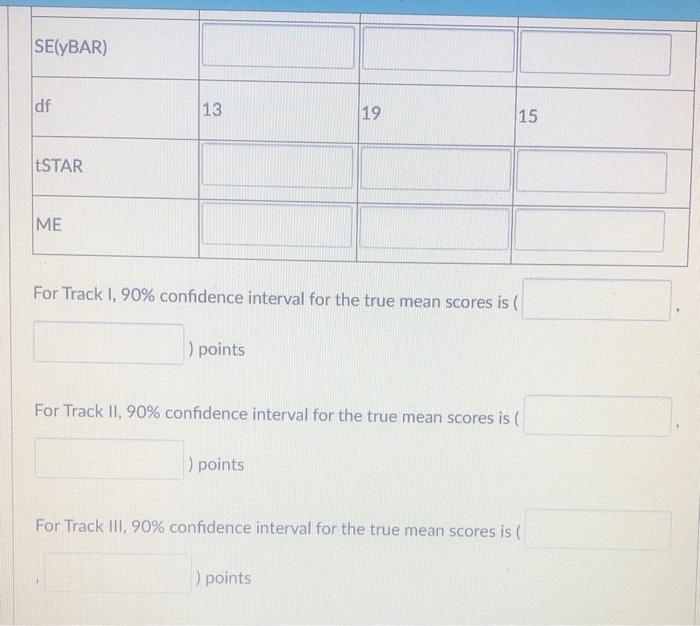
File Home Insert Draw Page Layout Formulas Data Calibri 11 ' ' == Paste BIU A Clipboard Font Alignme POSSIBLE DATA LOSS Some features might be lost if you save this workbook in the Al 3 X Vi Track_1 D G H 1 Track 2 3 4 5 6 7 8 9 10 11 12 13 14 15 8 Track_11 Track_1 80 85 42 92 82 32 68 48 36 85 75 31 72 53 65 87 73 29 85 65 43 91 78 19 90 49 53 81 69 14 62 72 61 29 81 31 61 53 42 83 59 30 68 39 52 32 71 61 59 52 16 17 18 19 20 21 22 22 tracks Ready E Type here to search o A school desires to estimate the average score that may be obtained on a reading comprehension exam for students in the sixth grade. The school's students are grouped into three tracks, with the fast learners in track I, the slow learners in track III, and the rest in track II. The school decides to stratify on tracks because this method should reduce the variability of test scores. The simple random samples from tracks I, ll, and III are saved as tracks.csv For each of the three tracks, find 90% confidence interval for the true mean scores. Write your answers to 2 decimal places. Track Track 11 Track III Sample size (n) 14 20 16 Mean (YBAR) Standard deviation (s) SEYBAR) df 13 19 15 STAR SE(YBAR) df 13 19 15 ESTAR ME For Track 1, 90% confidence interval for the true mean scores is ( points For Track II, 90% confidence interval for the true mean scores is ( points For Track III, 90% confidence interval for the true mean scores is ( points
Step by Step Solution
There are 3 Steps involved in it

Get step-by-step solutions from verified subject matter experts