

Question: File Home Insert Draw Page Layout Formulas Data Review View Help E13 fx The price per share of stock for a sample of 25 companies
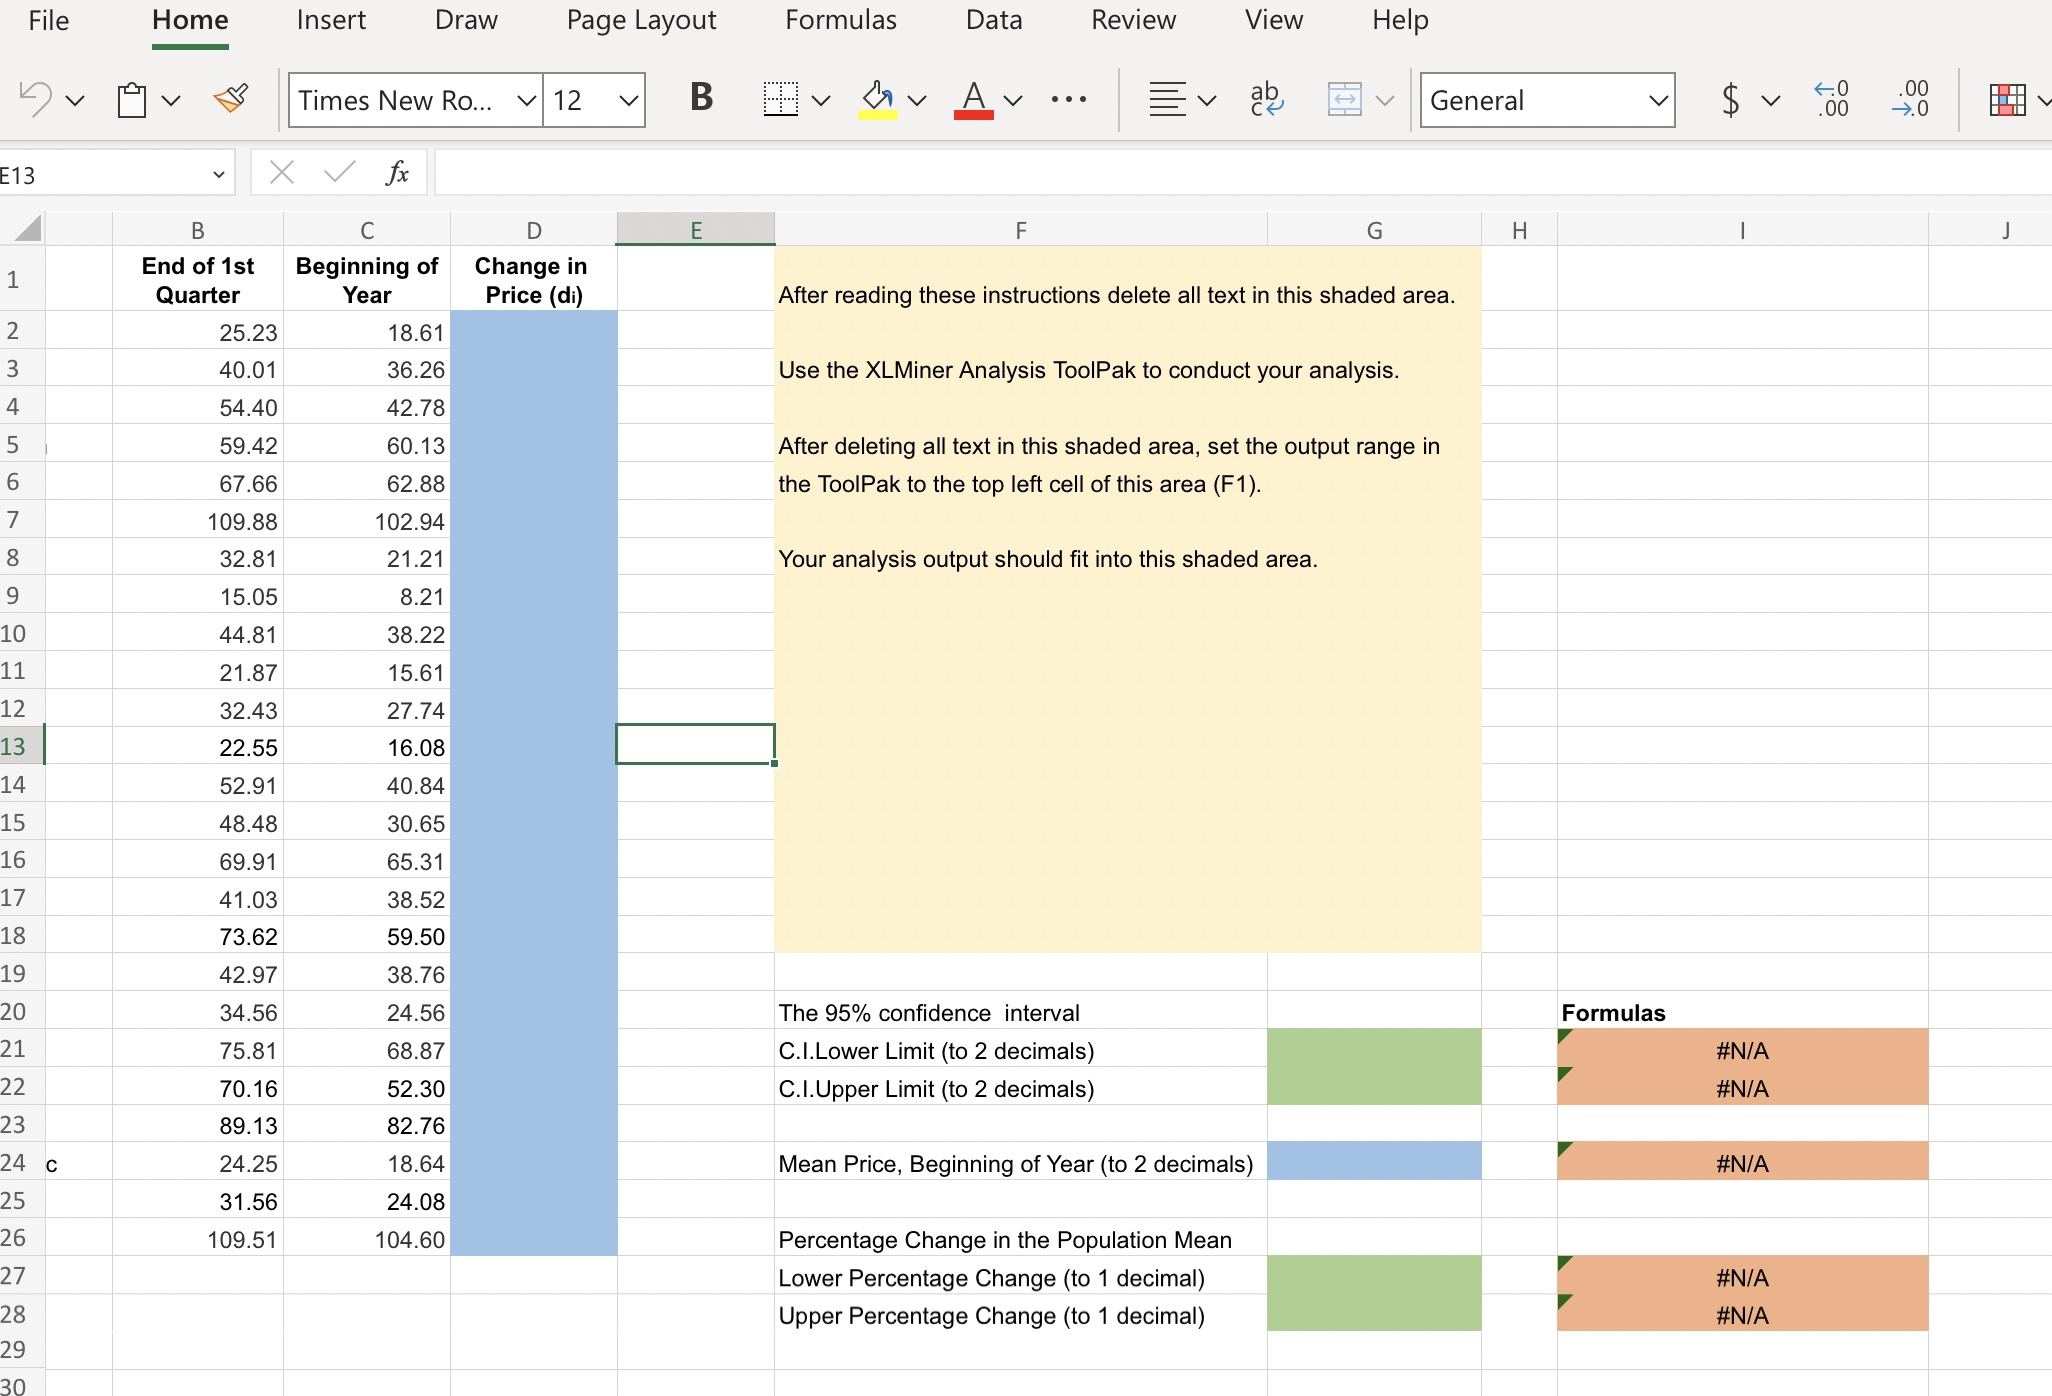
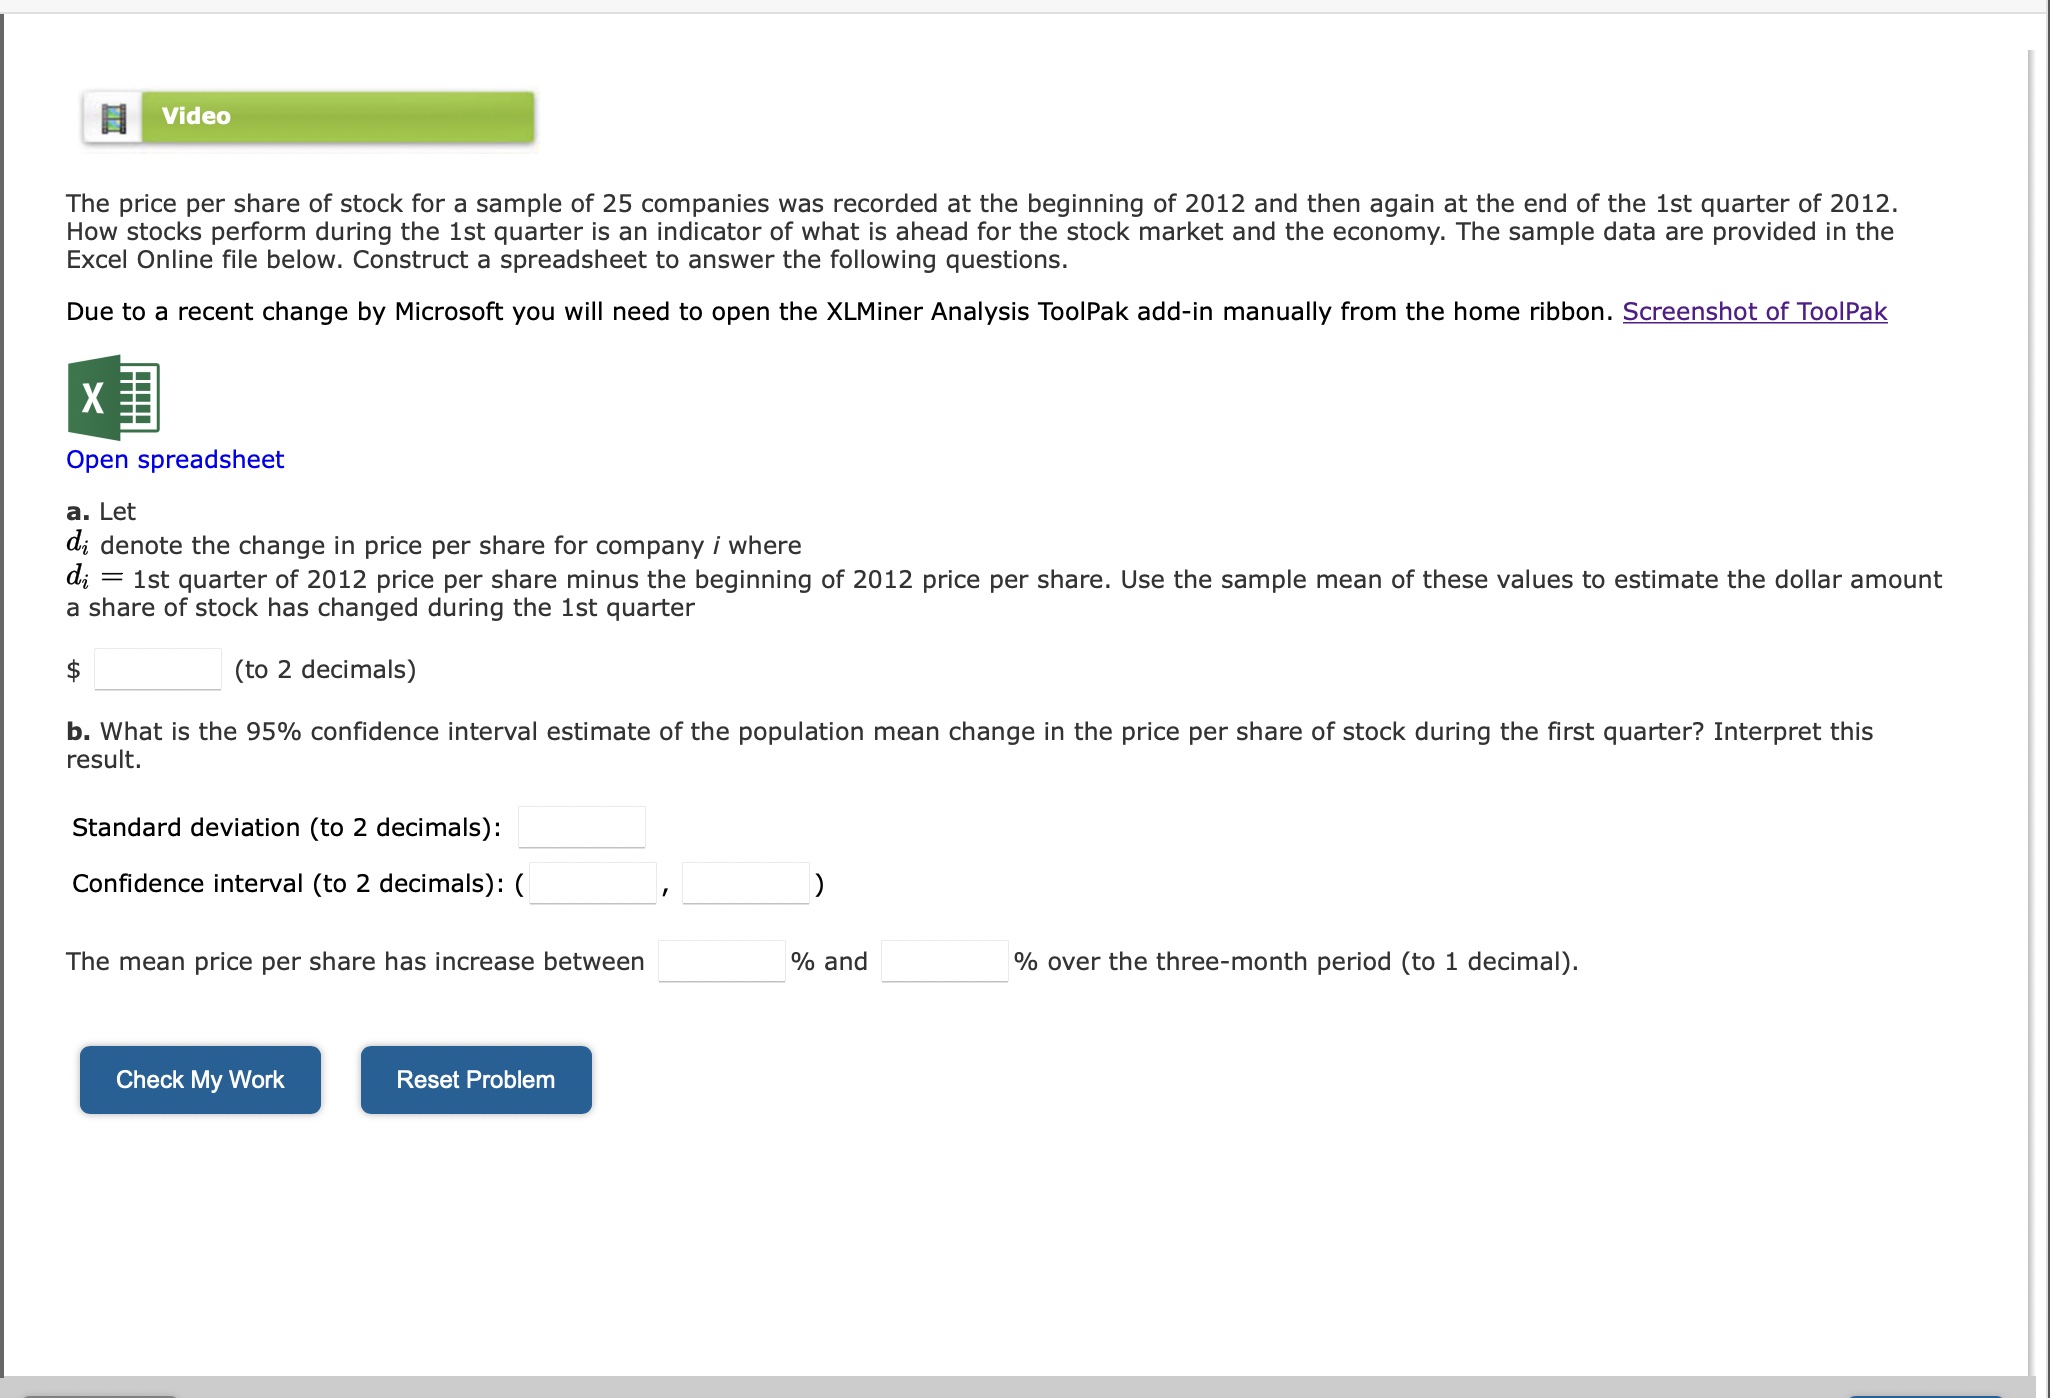
File Home Insert Draw Page Layout Formulas Data Review View Help E13 fx The price per share of stock for a sample of 25 companies was recorded at the beginning of 2012 and then again at the end of the 1 st quarter of 2012 . How stocks perform during the 1st quarter is an indicator of what is ahead for the stock market and the economy. The sample data are provided in the Excel Online file below. Construct a spreadsheet to answer the following questions. Due to a recent change by Microsoft you will need to open the XLMiner Analysis ToolPak add-in manually from the home ribbon. Screenshot of ToolPak Open spreadsheet a. Let di denote the change in price per share for company i where di=1 st quarter of 2012 price per share minus the beginning of 2012 price per share. Use the sample mean of these values to estimate the dollar amount a share of stock has changed during the 1st quarter $ (to 2 decimals) b. What is the 95% confidence interval estimate of the population mean change in the price per share of stock during the first quarter? Interpret this result. Standard deviation (to 2 decimals): Confidence interval (to 2 decimals): ( , ) The mean price per share has increase between % and % over the three-month period (to 1 decimal). File Home Insert Draw Page Layout Formulas Data Review View Help E13 fx The price per share of stock for a sample of 25 companies was recorded at the beginning of 2012 and then again at the end of the 1 st quarter of 2012 . How stocks perform during the 1st quarter is an indicator of what is ahead for the stock market and the economy. The sample data are provided in the Excel Online file below. Construct a spreadsheet to answer the following questions. Due to a recent change by Microsoft you will need to open the XLMiner Analysis ToolPak add-in manually from the home ribbon. Screenshot of ToolPak Open spreadsheet a. Let di denote the change in price per share for company i where di=1 st quarter of 2012 price per share minus the beginning of 2012 price per share. Use the sample mean of these values to estimate the dollar amount a share of stock has changed during the 1st quarter $ (to 2 decimals) b. What is the 95% confidence interval estimate of the population mean change in the price per share of stock during the first quarter? Interpret this result. Standard deviation (to 2 decimals): Confidence interval (to 2 decimals): ( , ) The mean price per share has increase between % and % over the three-month period (to 1 decimal)
Step by Step Solution
There are 3 Steps involved in it

Get step-by-step solutions from verified subject matter experts