

Question: File Home Insert Draw Page Layout Formulas Data Review View Help Share Comm Calibri 12 ~ A A E Insert ab General Ex APO x
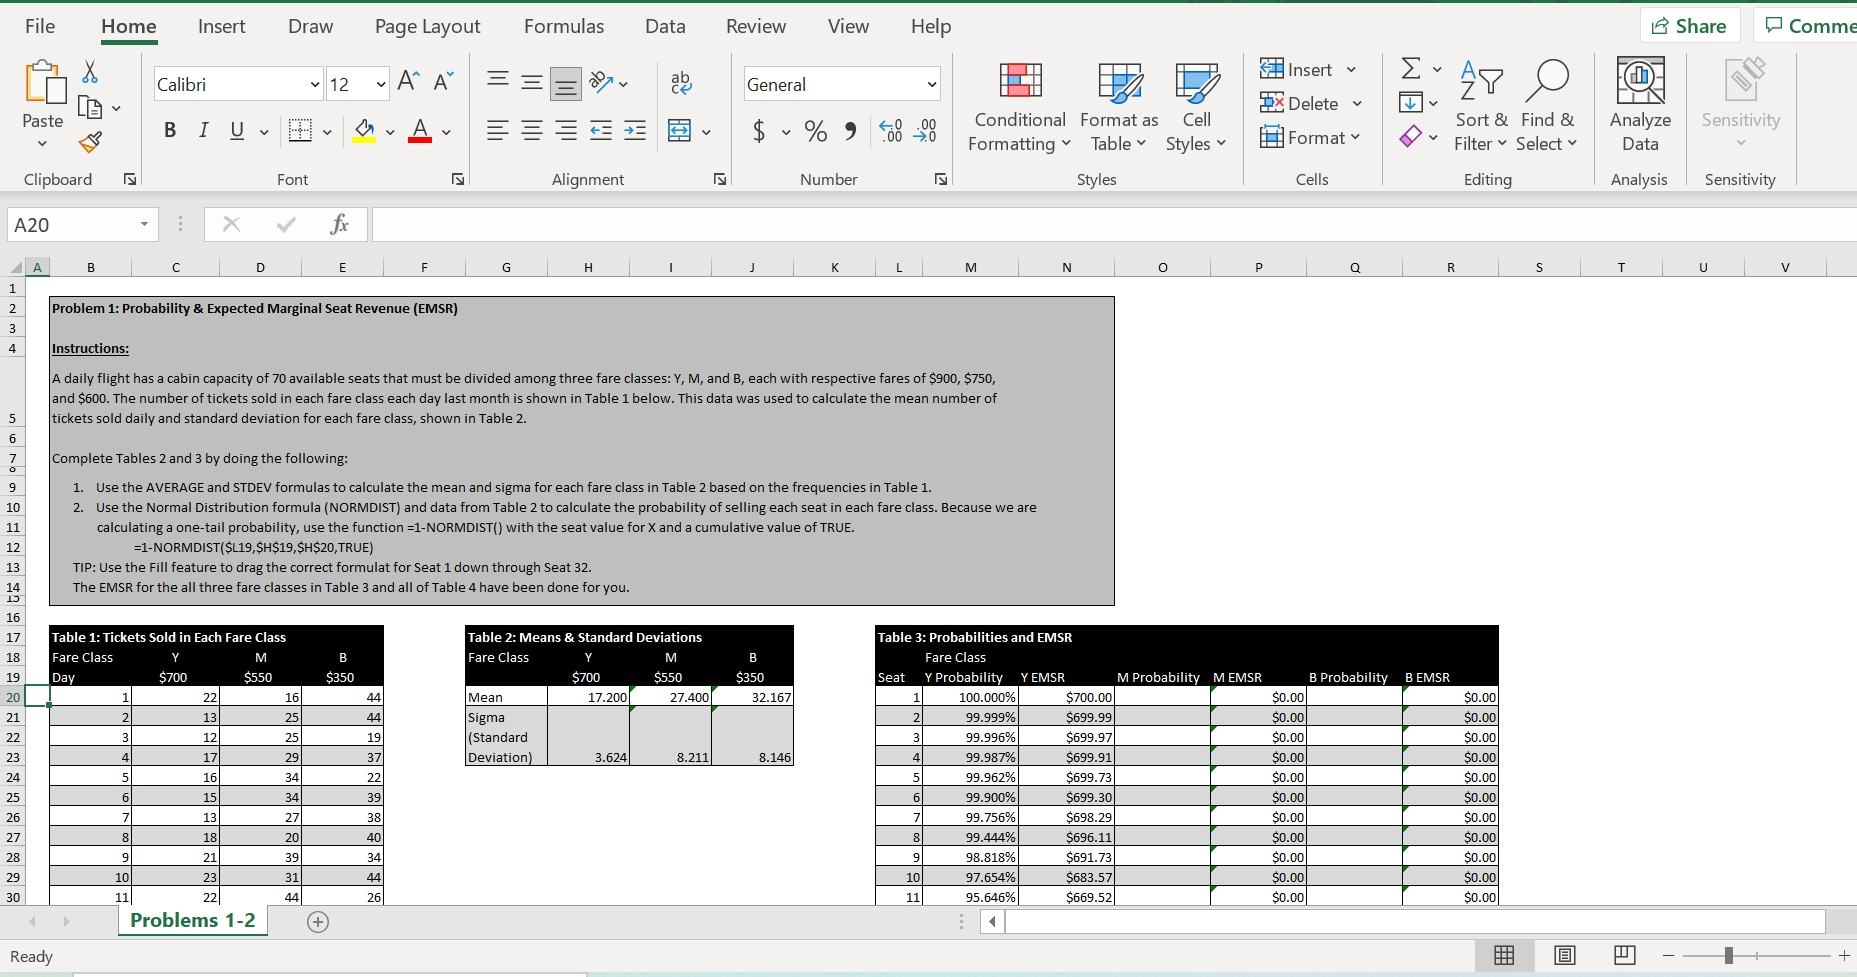
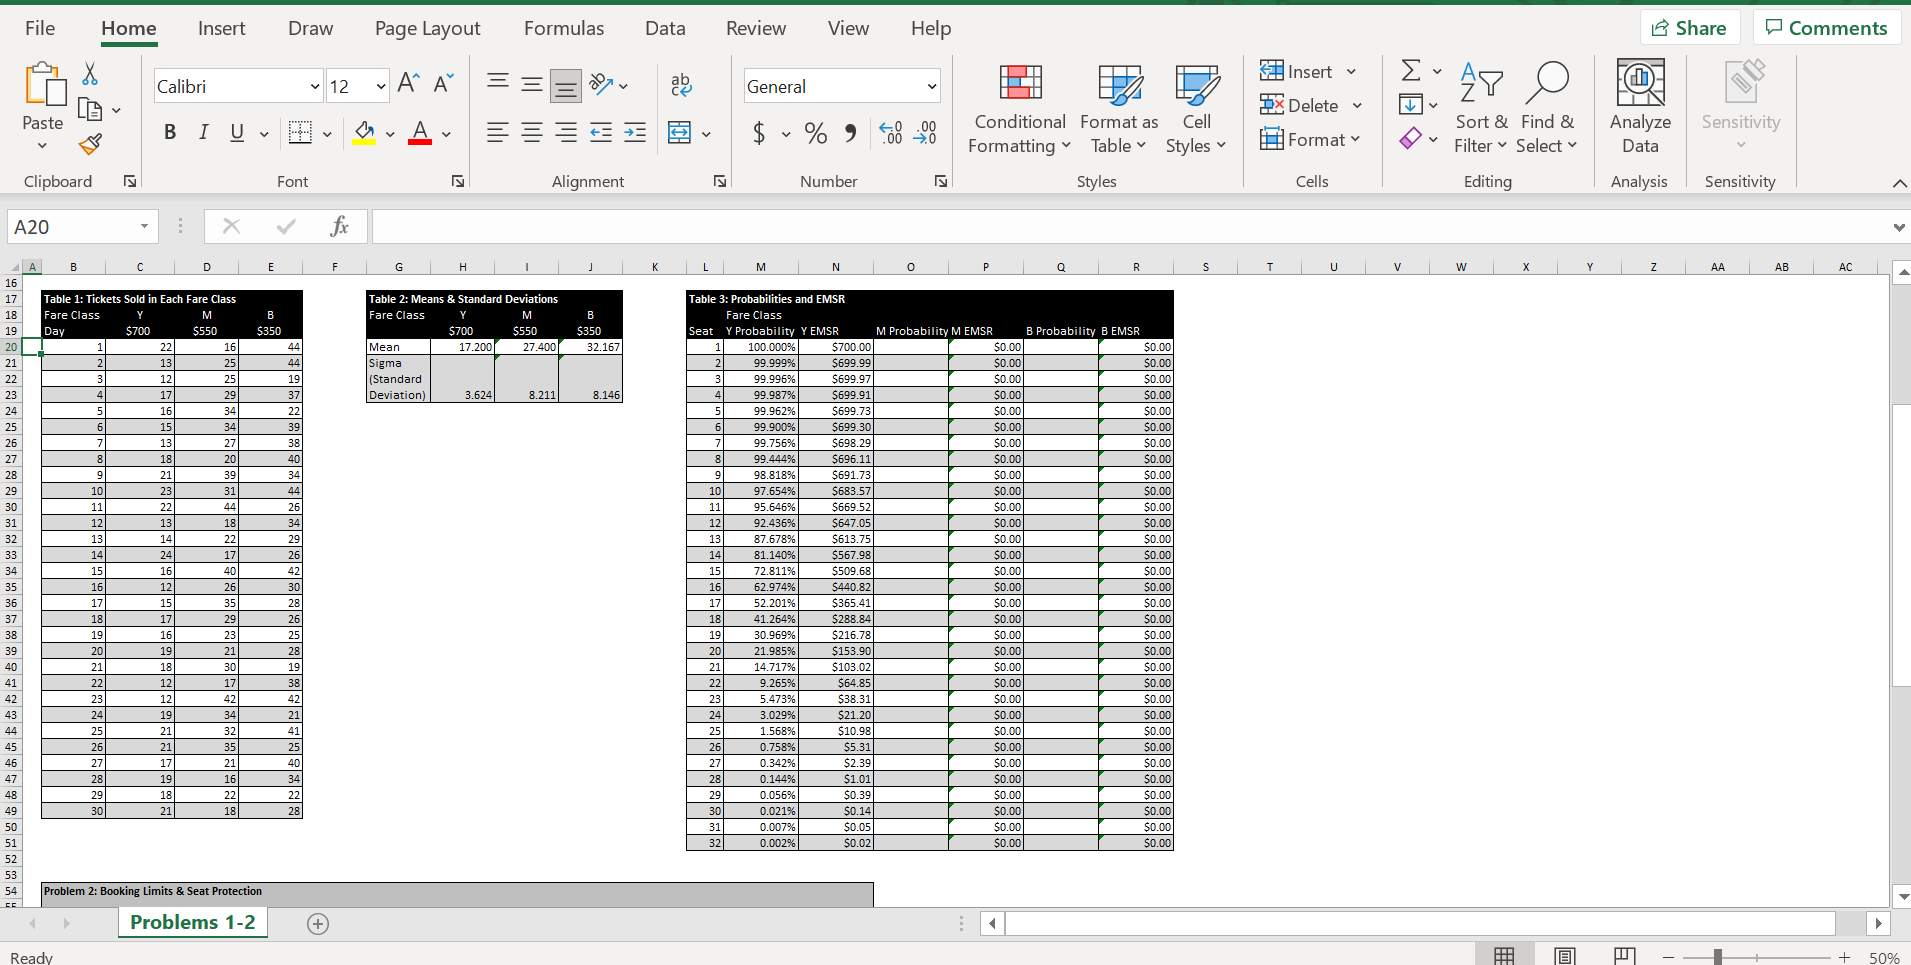
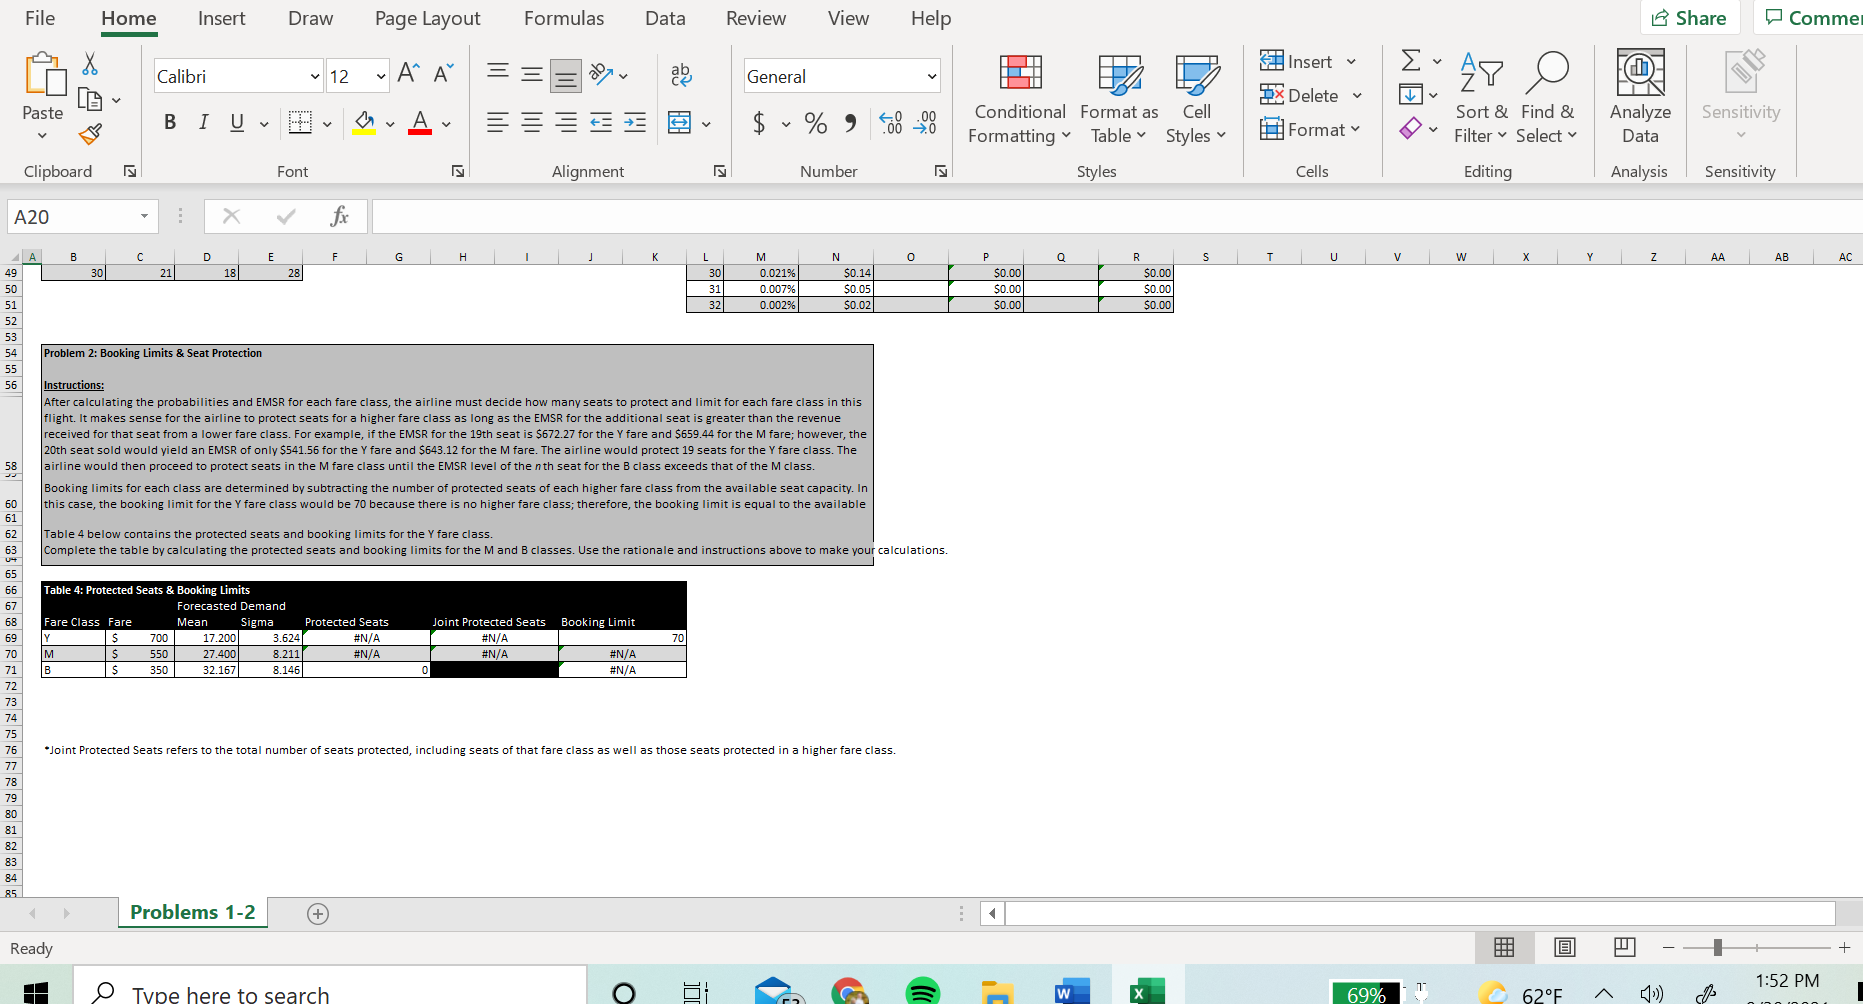
File Home Insert Draw Page Layout Formulas Data Review View Help Share Comm Calibri 12 ~ A" A E Insert ab General Ex APO x Delete Iv Paste BIUVv VVAv I V $ ~ % " .00 Conditional Format as Cell Sort & Find & Analyze Sensitivity 00 Formatting " Table Styles v Format Filter ~ Select Data Clipboard Font Alignment Number Styles Cells Editing Analysis Sensitivity A20 X V B D E F G H K L M N O P Q R S U V Problem 1: Probability & Expected Marginal Seat Revenue (EMSR) A W N Instructions: A daily flight has a cabin capacity of 70 available seats that must be divided among three fare classes: Y, M, and B, each with respective fares of $900, $750, and $600. The number of tickets sold in each fare class each day last month is shown in Table 1 below. This data was used to calculate the mean number of tickets sold daily and standard deviation for each fare class, shown in Table 2. Complete Tables 2 and 3 by doing the following: 1. Use the AVERAGE and STDEV formulas to calculate the mean and sigma for each fare class in Table 2 based on the frequencies in Table 1. 10 2. Use the Normal Distribution formula (NORMDIST) and data from Table 2 to calculate the probability of selling each seat in each fare class. Because we are 11 calculating a one-tail probability, use the function =1-NORMDIST() with the seat value for X and a cumulative value of TRUE. 12 =1-NORMDIST($L19,$H$19,$H$20, TRUE) TIP: Use the Fill feature to drag the correct formulat for Seat 1 down through Seat 32. 14 The EMSR for the all three fare classes in Table 3 and all of Table 4 have been done for you. 16 17 Table 1: Tickets Sold in Each Fare Class Table 2: Means & Standard Deviations Table 3: Probabilities and EMSR 18 Fare Class M B Fare Class are Class 19 Day $700 $550 $35 $700 $550 $350 Seat Y Probability Y EMSR M Probability M EMSR B Probability BEMSR 20 16 44 Mean 17.200 27.400 32.167 100.000% $700.00 $0.00 $0.00 25 44 Sigma 99.999% $699.99 $0.00 $0.00 25 19 Standard w 99.996% $699.97 $0.0 $0.00 29 37 Deviation) 3.624 8.211 8.146 4 99.987% $699.91 $0.0 $0.00 99.962% $699.73 $0.00 $0.00 99.900% $699.30 $0.00 $0.00 99.756% $698.29 $0.00 $0.00 8 99.444% $696.11 $0.0 $0.00 9 98.818% $691.73 $0.00 $0.00 10 97.654% $683.57 $0.00 $0.00 11 95.646% $669.52 $0.00 $0.00 Problems 1-2 + Ready - -File Home Insert Draw Page Layout Formulas Data Review View Help Share Comments A A Insert Calibri v 12 General Ex APO CA x Delete Paste BIUV $ ~ % 9 00 20 Conditional Format as Cell Sort & Find & Analyze Sensitivity Formatting Table Styles v Format Filter ~ Select v Data Clipboard Font IN Alignment Number Styles Cells Editing Analysis Sensitivity A20 X V fx A B D G H L M 0 Q S U V w Z AA AB AC 16 able 1: Tickets Sold in Each Fare Class Table 2: Means & Standard Deviations able 3: Probabilities and EMSR Fare Class M B Fare Class M Fare Class Day $700 $550 5350 $700 $550 $350 Seat Y Probability Y EMSR M Probability M EMSR B Probability B EMSR 44 Mean 17.200 27.400 32.167 1 100.000% $700.00 50.00 50.00 Sigma 99.999% $699.99 $0.00 (Standard 1 5 W N 99.996% $699.97 $0.00 $0.00 Deviation) 3.624 8.211 8.146 99.987% $699.91 $0.00 $0.00 99.962% $699.73 $0.00 $0.00 99.900% $699.30 $0.00 $0.00 99.756% $698.29 $0.00 $0.00 99.444% $696.11 $0.00 $0.00 98.818% $691.73 $0.00 $0.00 10 97.654% $683.57 $0.00 $0.00 11 95.646% $669.52 $0.00 SO.00 12 92.436% $647.05 0.00 $0.00 13 87.678% 613.75 $0.00 SO.00 14 81.140% $567.98 50.00 $0.00 15 72.811% $509.68 $0.00 $0.00 16 62.974% $440.82 $0.00 $0.00 52.201% $365.41 $0.00 $0.00 41.264% $288.84 $0.00 $0.00 30.969% $216.78 50.00 $0.00 21.985% $153.90 $0.00 $0.00 14.717% $103.02 $0.00 $0.00 9.265% $64.85 50.00 $0.00 5.473% $38.31 $0.00 $0.00 3.029% $21.20 0.00 So.00 1.568% $10.98 $0.00 $0.00 0.758% $5.31 $0.00 SO.00 0.342% $2.39 $0.00 $0.00 0.144% $1.01 $0.00 $0.00 0.056% $0.39 $0.00 $0.00 0.021% $0.14 50.00 $0.00 0.007% $0.05 $0.00 $0.00 0.002% $0.02 $0.00 $0.00 Problem 2: Booking Limits & Seat Protection Problems 1-2 (+ Ready + 50%File Home Insert Draw Page Layout Formulas Data Review View Help 15 Share Comme Insert Calibri v 12 ~ A" A ag General Delete Paste BIUV OvAv $ ~ % " Conditional Format as Cell Sort & Find & Analyze Sensitivity Formatting Table Styles Format Filter ~ Select Data Clipboard Font Alignment Number Styles Cells Editing Analysis Sensitivity A20 X fx D G H M S T V w Z AA AB AC 30 21 18 28 0.021% $0.14 0.00 50.00 0.007% $0.05 $0.00 $0.00 0.002% 50.02 $0.00 $0.00 Problem 2: Booking Limits & Seat Protection Instructions: After calculating the probabilities and EMSR for each fare class, the airline must decide how many seats to protect and limit for each fare class in this flight. It makes sense for the airline to protect seats for a higher fare class as long as the EMSR for the additional seat is greater than the revenue received for that seat from a lower fare class. For example, if the EMSR for the 19th seat is $672.27 for the Y fare and $659.44 for the M fare; however, the 20th seat sold would yield an EMSR of only $541.56 for the Y fare and $643.12 for the M fare. The airline would protect 19 seats for the Y fare class. The 58 airline would then proceed to protect seats in the M fare class until the EMSR level of the noth seat for the B class exceeds that of the M class Booking limits for each class are determined by subtracting the number of protected seats of each higher fare class from the available seat capacity. In this case, the booking limit for the Y fare class would be 70 because there is no higher fare class; therefore, the booking limit is equal to the available Table 4 below contains the protected seats and booking limits for the Y fare class. Complete the table by calculating the protected seats and booking limits for the M and B classes. Use the rationale and instructions above to make your calculations. :9 8 18 8 28 Table 4: Protected Seats & Booking Limits Forecasted Demand Fare Class Fare Mean Sigma Protected Seats Joint Protected Seats Booking Limit 700 17.200 3.624 #N/A #N/A 70 70 550 27.400 8.211 #N/A #N/A #N/A 350 32.167 8.146 #N/A "Joint Protected Seats refers to the total number of seats protected, including seats of that fare class as well as those seats protected in a higher fare class. Problems 1-2 + Ready - O Type here to search O W 1:52 PM 69% 62 OF
Step by Step Solution
There are 3 Steps involved in it

Get step-by-step solutions from verified subject matter experts