

Question: File Home Insert Draw Page Layout Formulas Data Review View Help Share Comments Calibri 10 AA == Wrap Text General 14 DZ Normal Bad Good
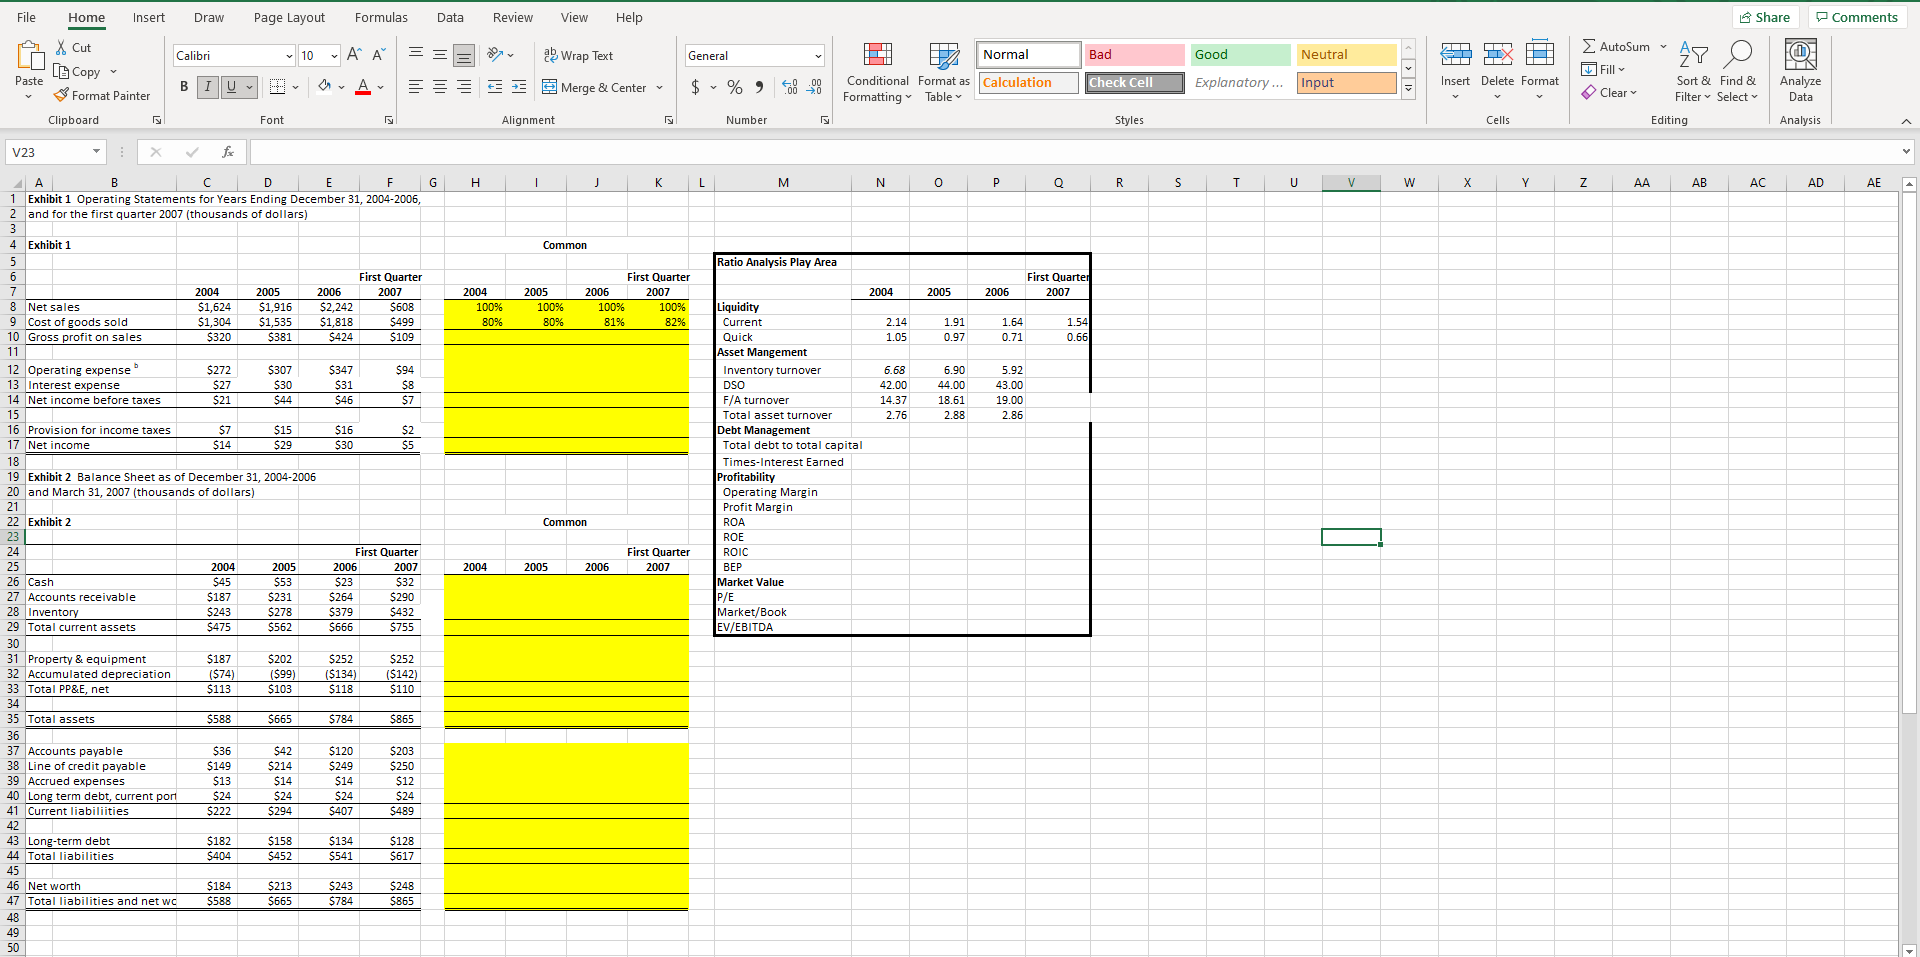
File Home Insert Draw Page Layout Formulas Data Review View Help Share Comments Calibri 10 AA == Wrap Text General 14 DZ Normal Bad Good Neutral DI Yx NT AY X Cut Lo Copy Format Painter > Paste F IN Analyze Data B U 3 Merge & Center $ % ) 28 29 Check Cell Conditional Format as Calculation Formatting Table Explanatory... Input Insert Delete Format AutoSum Till Sort & Find & Clear Filter Select Editing Clipboard Font Alignment Number Styles Cells Analysis V23 X fx . 1 J K L M N 0 P 0 R S T V w X Y Z AA AB AC AD AE B D E F 1 Exhibit 1 Operating Statements for Years Ending December 31, 2004-2006, and for the first quarter 2007 (thousands of dollars) 4 Exhibit 1 Common Ratio Analysis Play Area First Quartell 2007 2005 2006 2004 100% 80% 2005 100% 80% First Quarter 2006 2007 100% 100% 81% 82% 1.91 0.97 1.64 0.71 1.54 0.66 6 First Quarter 2004 2005 2006 2007 8 Net sales $1,624 $1.916 $2,242 $608 9 Cost of goods sold $1,304 $1,535 $1,818 $499 10 Gross profit on sales $320 $381 $424 $109 11 12 Operating expense $272 $307 $347 $94 13 Interest expense $27 $30 $31 $8 14 Net income before taxes $21 $44 $46 $7 15 16 Provision for income taxes $7 $15 $16 $2 17 Net income $14 $29 $30 $5 18 19 Exhibit 2 Balance Sheet as of December 31, 2004-2006 20 and March 31, 2007 (thousands of dollars) 21 22 Exhibit 2 6.90 44.00 18.61 2.88 5.92 43.00 19.00 2.86 2004 Liquidity Current 2.14 Quick 1.05 Asset Mangement Inventory turnover 6.68 DSO 42.00 F/A turnover 14.37 Total asset turnover 2.76 Debt Management Total debt to total capital Times-Interest Earned Profitability Operating Margin Profit Margin ROA ROE ROIC BEP Market Value P/E Market/Book EV/EBITDA Common First Quarter 2007 2004 2005 2006 24 25 26 Cash 27 Accounts receivable 28 Inventory 29 Total current assets 30 31 Property & equipment 32 Accumulated depreciation 33 Total PP&E, net 2004 $45 $187 $243 $475 2005 $53 $231 $278 $562 First Quarter 2006 2007 $23 $32 $264 $290 $379 $432 $666 $755 $187 ($74) $113 $202 ($99) $103 $252 ($134) $118 $252 ($142) $110 $588 $665 $784 $865 $36 $149 $13 $24 $222 $42 $214 $14 $24 $294 $120 $249 $14 $24 $407 $203 $250 $12 $24 $489 25 35 Total assets 36 37 Accounts payable 38 Line of credit payable 39 Accrued expenses 40 Long term debt, current por 41 Current liabilities 42 43 Long-term debt 44 Total liabilities 45 46 Net worth 47 Total liabilities and net wc 48 49 50 $182 $404 $158 $452 $134 $541 $128 $617 $184 $588 $213 $665 $243 $784 $248 $865 File Home Insert Draw Page Layout Formulas Data Review View Help Share Comments Calibri 10 AA == Wrap Text General 14 DZ Normal Bad Good Neutral DI Yx NT AY X Cut Lo Copy Format Painter > Paste F IN Analyze Data B U 3 Merge & Center $ % ) 28 29 Check Cell Conditional Format as Calculation Formatting Table Explanatory... Input Insert Delete Format AutoSum Till Sort & Find & Clear Filter Select Editing Clipboard Font Alignment Number Styles Cells Analysis V23 X fx . 1 J K L M N 0 P 0 R S T V w X Y Z AA AB AC AD AE B D E F 1 Exhibit 1 Operating Statements for Years Ending December 31, 2004-2006, and for the first quarter 2007 (thousands of dollars) 4 Exhibit 1 Common Ratio Analysis Play Area First Quartell 2007 2005 2006 2004 100% 80% 2005 100% 80% First Quarter 2006 2007 100% 100% 81% 82% 1.91 0.97 1.64 0.71 1.54 0.66 6 First Quarter 2004 2005 2006 2007 8 Net sales $1,624 $1.916 $2,242 $608 9 Cost of goods sold $1,304 $1,535 $1,818 $499 10 Gross profit on sales $320 $381 $424 $109 11 12 Operating expense $272 $307 $347 $94 13 Interest expense $27 $30 $31 $8 14 Net income before taxes $21 $44 $46 $7 15 16 Provision for income taxes $7 $15 $16 $2 17 Net income $14 $29 $30 $5 18 19 Exhibit 2 Balance Sheet as of December 31, 2004-2006 20 and March 31, 2007 (thousands of dollars) 21 22 Exhibit 2 6.90 44.00 18.61 2.88 5.92 43.00 19.00 2.86 2004 Liquidity Current 2.14 Quick 1.05 Asset Mangement Inventory turnover 6.68 DSO 42.00 F/A turnover 14.37 Total asset turnover 2.76 Debt Management Total debt to total capital Times-Interest Earned Profitability Operating Margin Profit Margin ROA ROE ROIC BEP Market Value P/E Market/Book EV/EBITDA Common First Quarter 2007 2004 2005 2006 24 25 26 Cash 27 Accounts receivable 28 Inventory 29 Total current assets 30 31 Property & equipment 32 Accumulated depreciation 33 Total PP&E, net 2004 $45 $187 $243 $475 2005 $53 $231 $278 $562 First Quarter 2006 2007 $23 $32 $264 $290 $379 $432 $666 $755 $187 ($74) $113 $202 ($99) $103 $252 ($134) $118 $252 ($142) $110 $588 $665 $784 $865 $36 $149 $13 $24 $222 $42 $214 $14 $24 $294 $120 $249 $14 $24 $407 $203 $250 $12 $24 $489 25 35 Total assets 36 37 Accounts payable 38 Line of credit payable 39 Accrued expenses 40 Long term debt, current por 41 Current liabilities 42 43 Long-term debt 44 Total liabilities 45 46 Net worth 47 Total liabilities and net wc 48 49 50 $182 $404 $158 $452 $134 $541 $128 $617 $184 $588 $213 $665 $243 $784 $248 $865
Step by Step Solution
There are 3 Steps involved in it

Get step-by-step solutions from verified subject matter experts