

Question: File Home Insert Page Layout Formulas Data Review View Automate Help Acrobat Comments 1 Share ~ B3 vilXV fav =SUM( ' Income Statement ' !B2/'
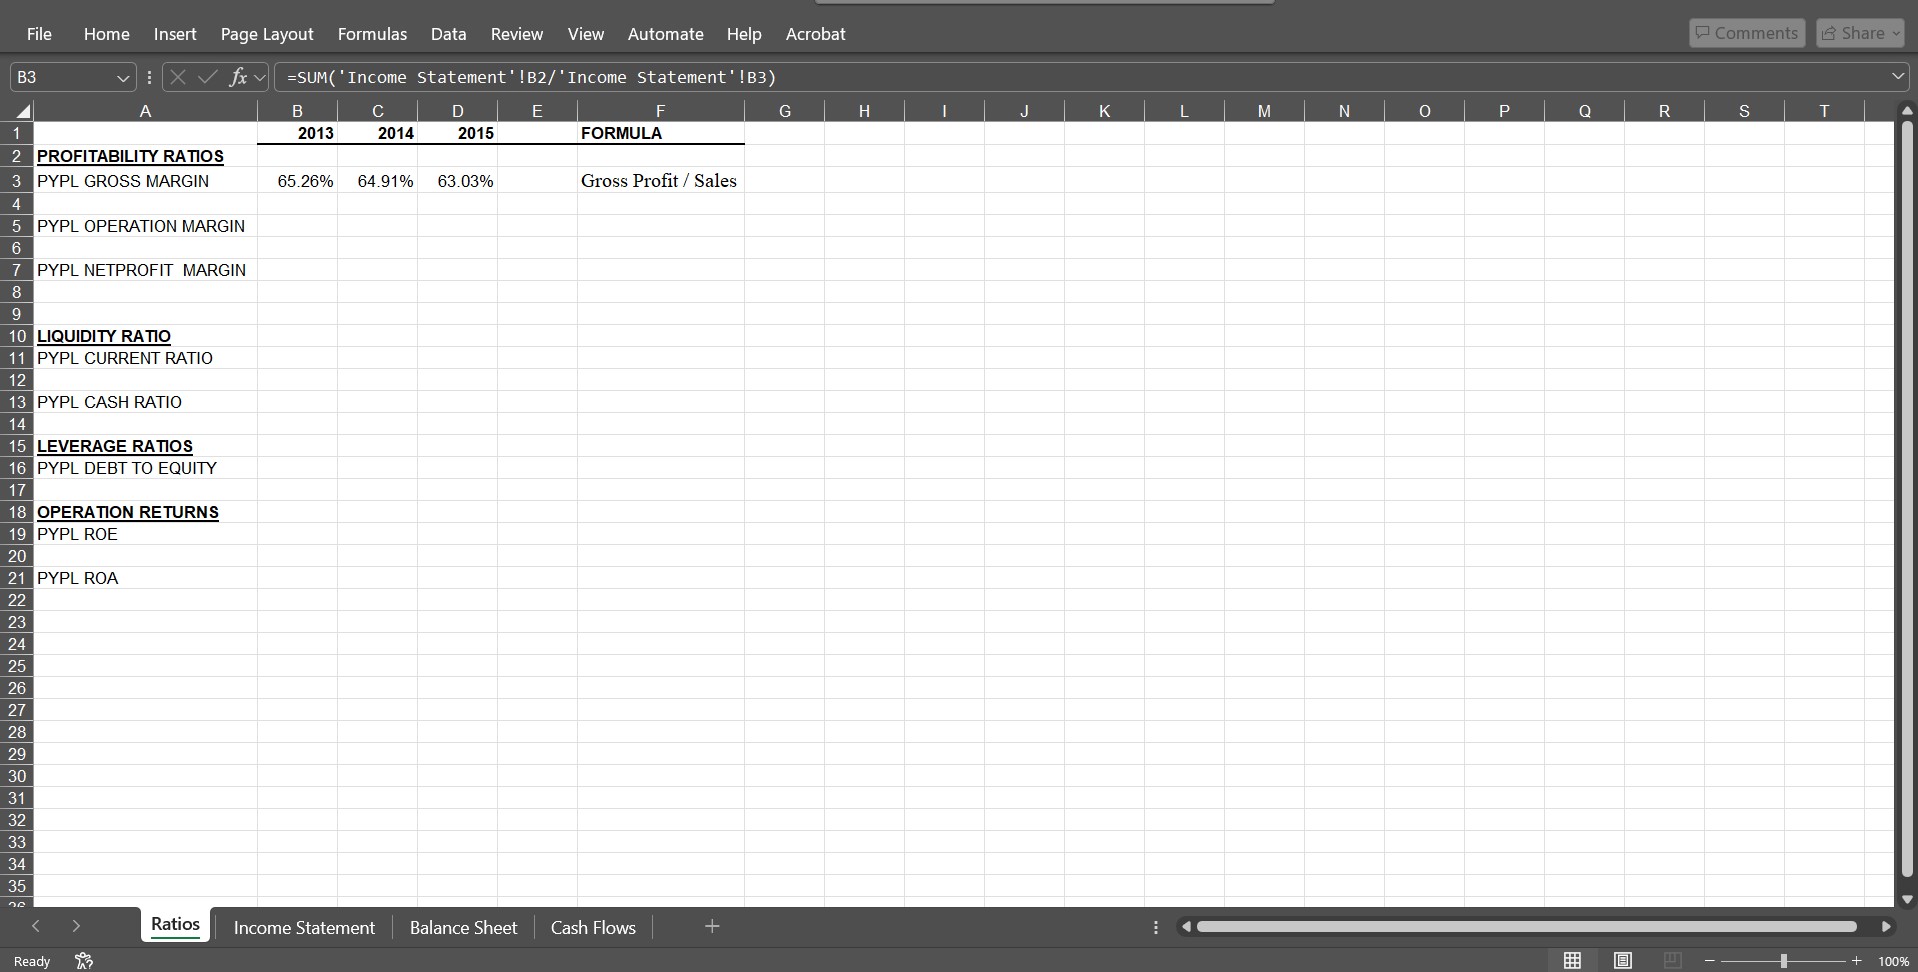
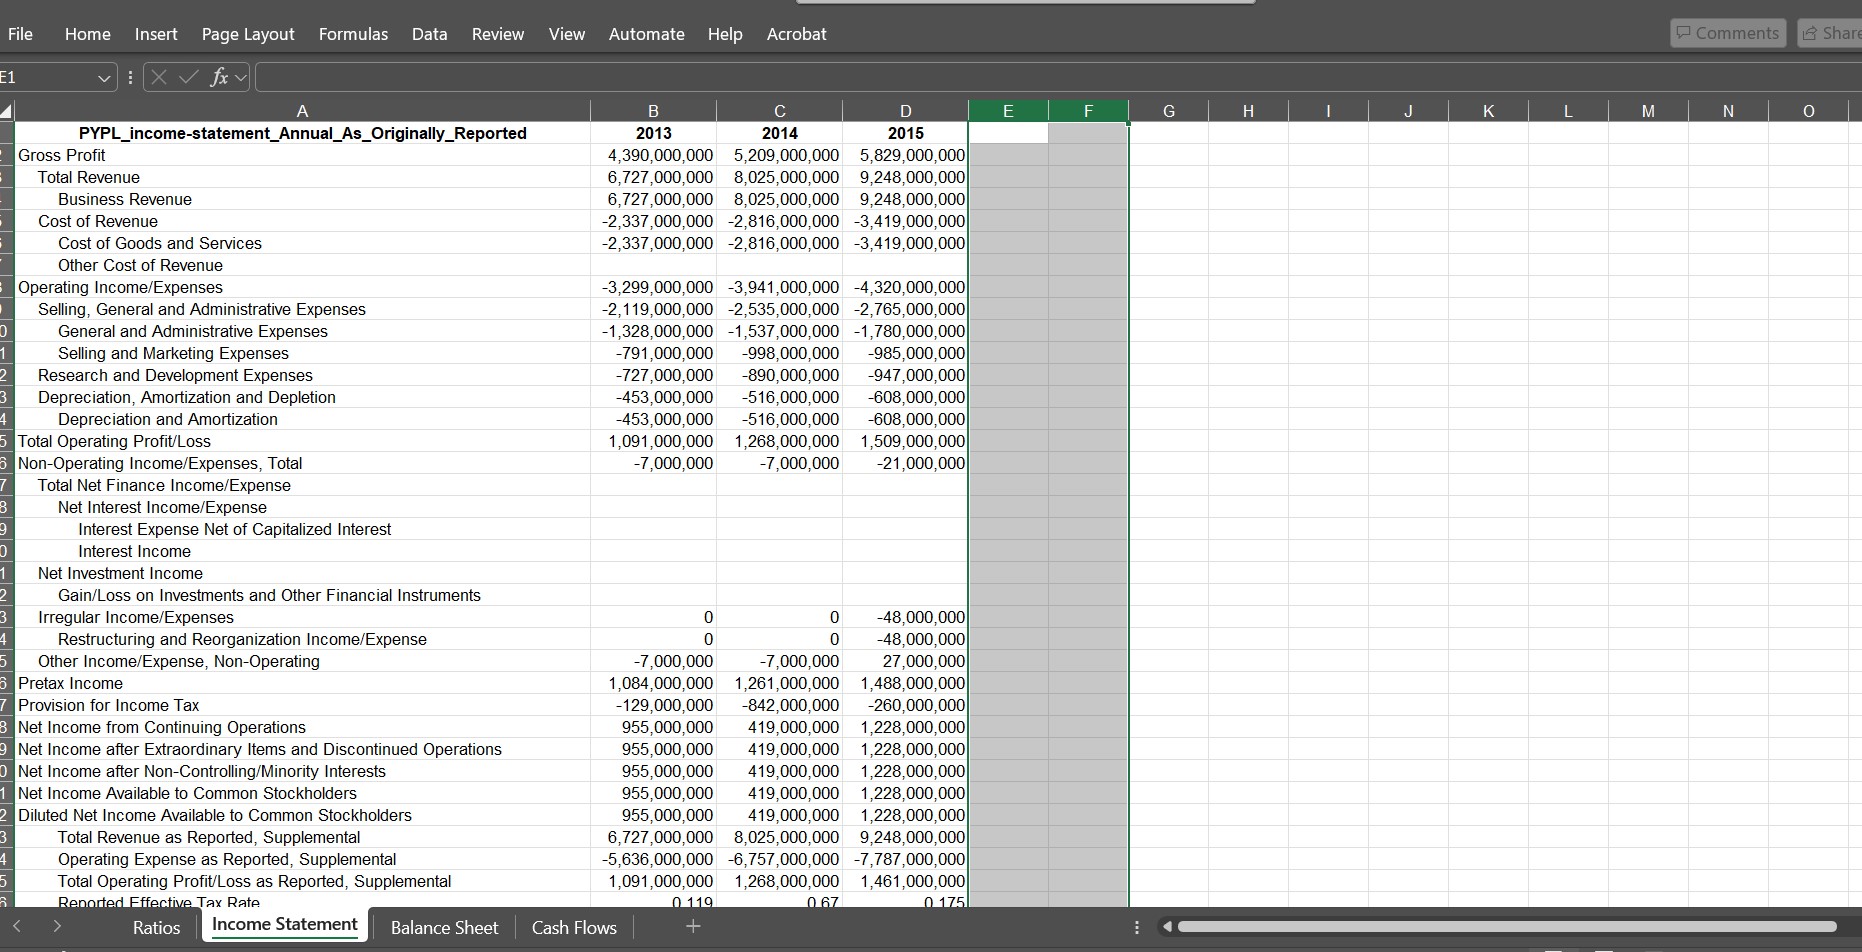
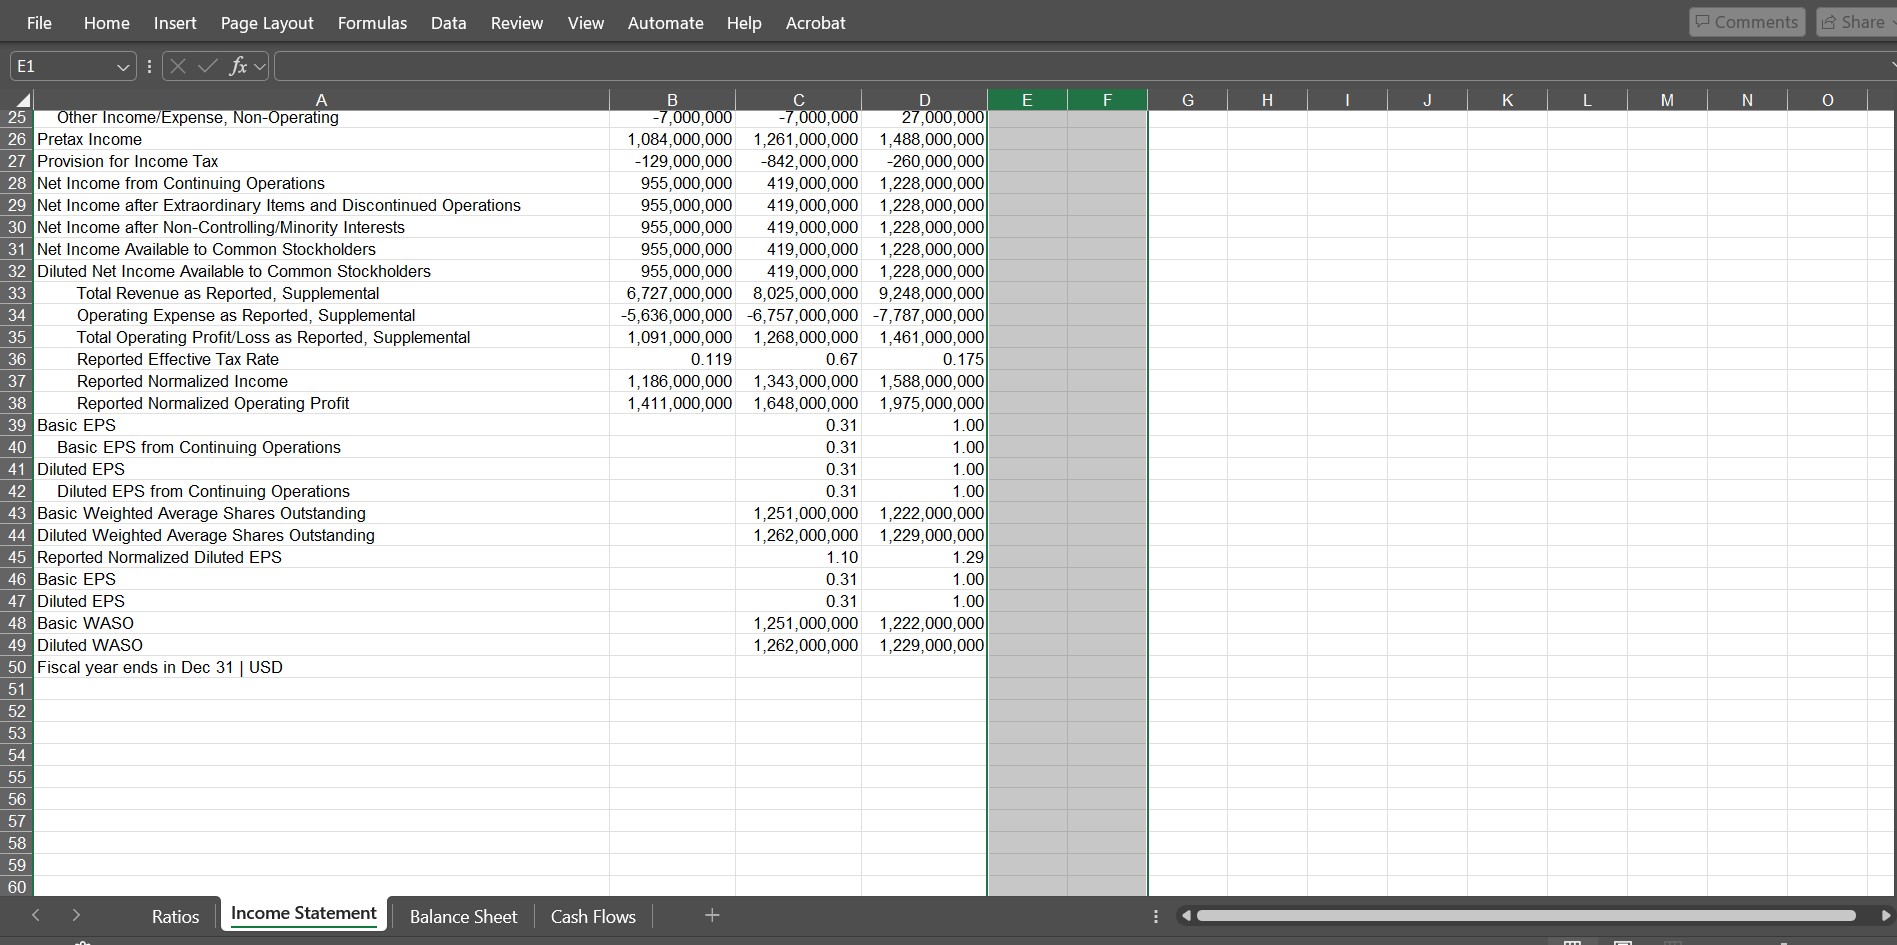
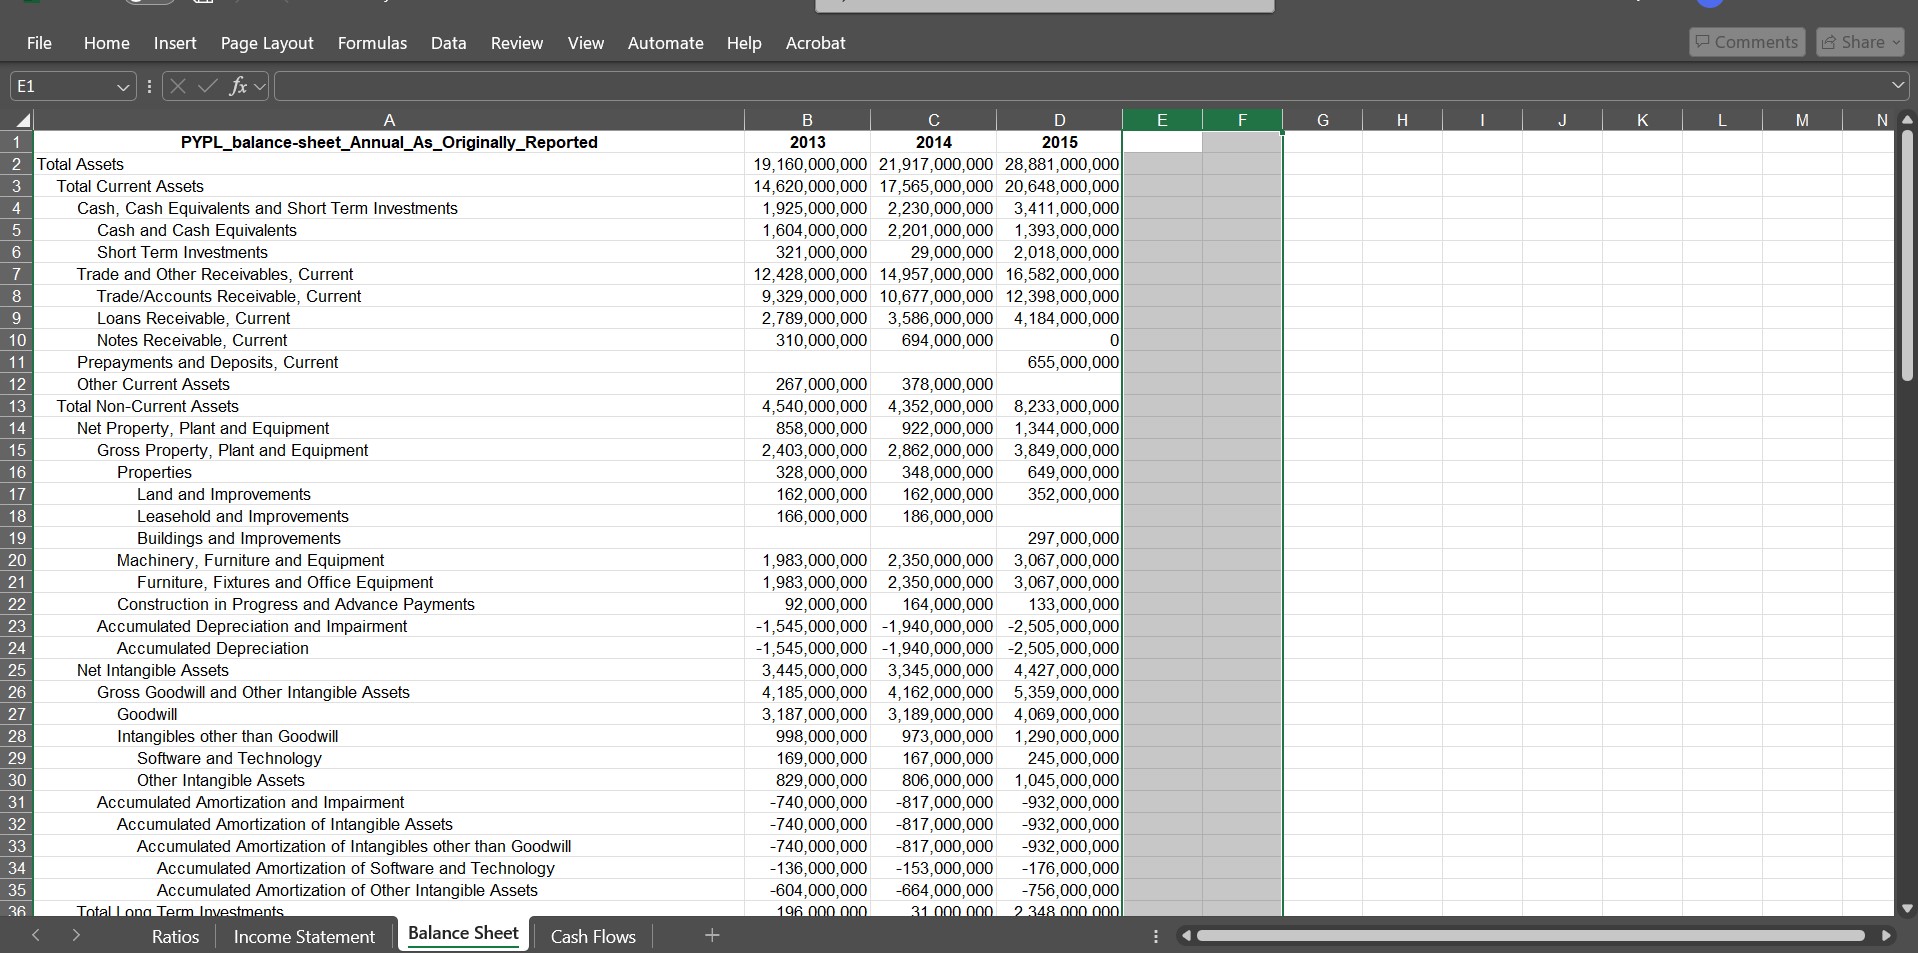
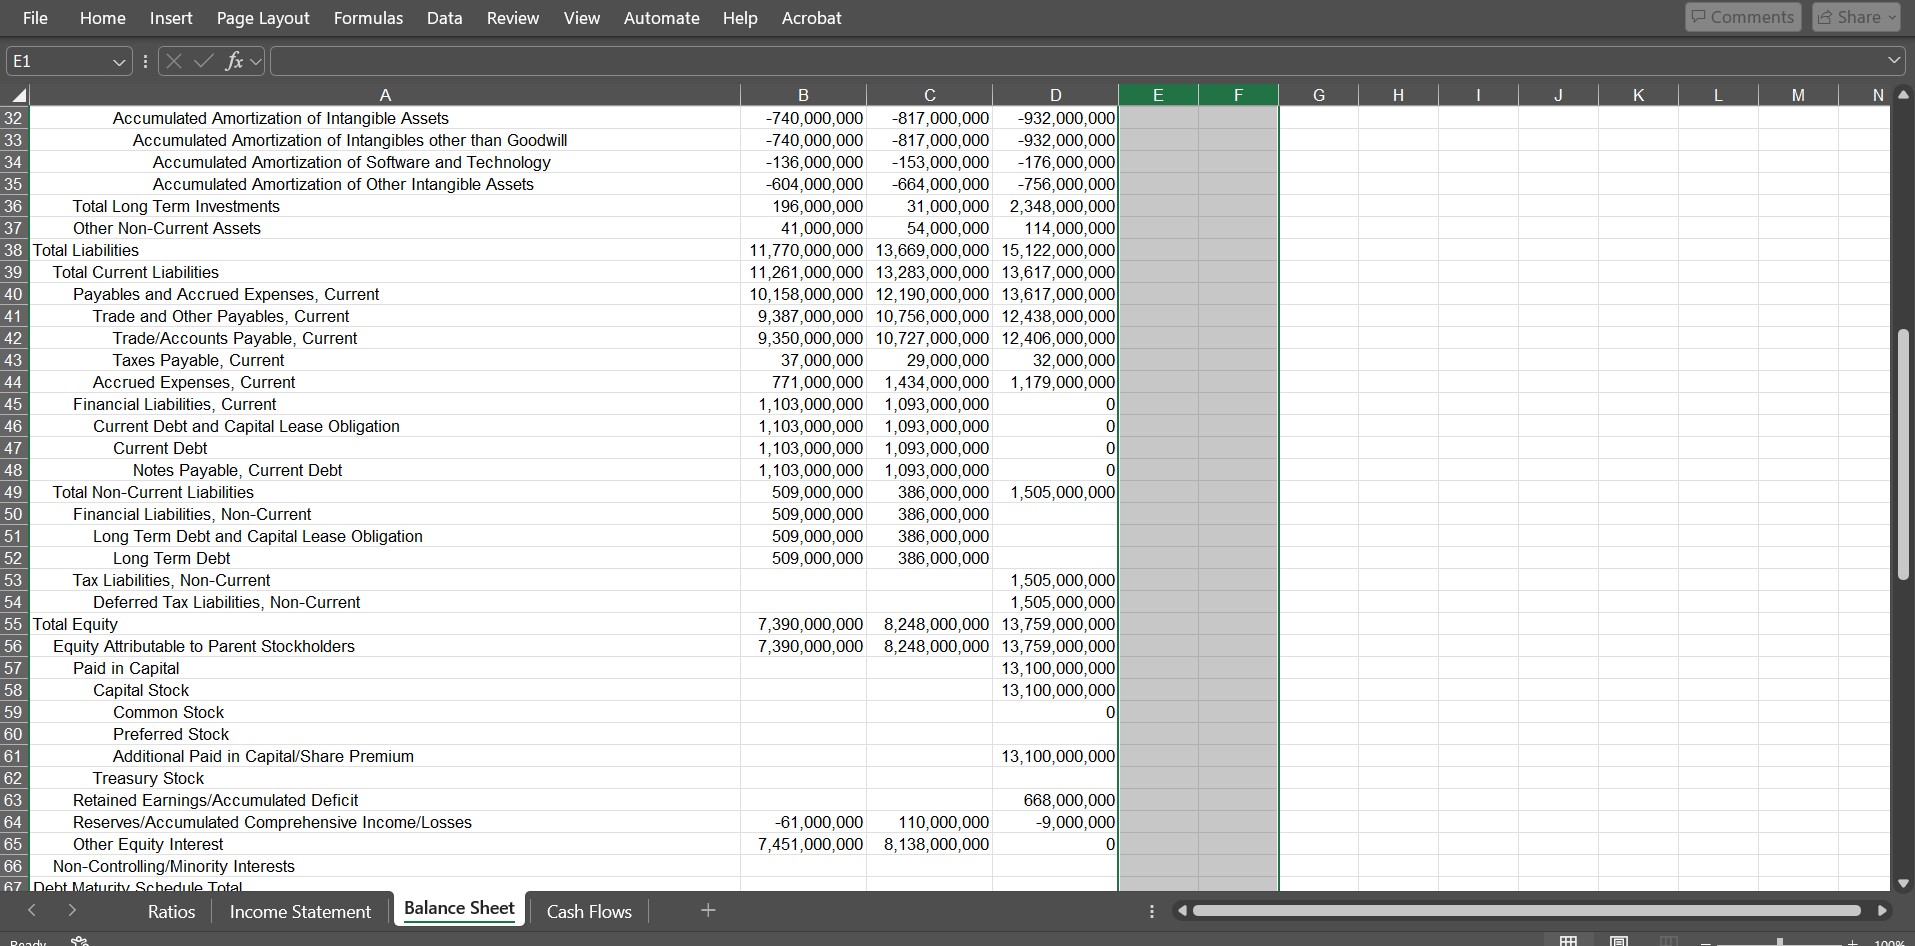
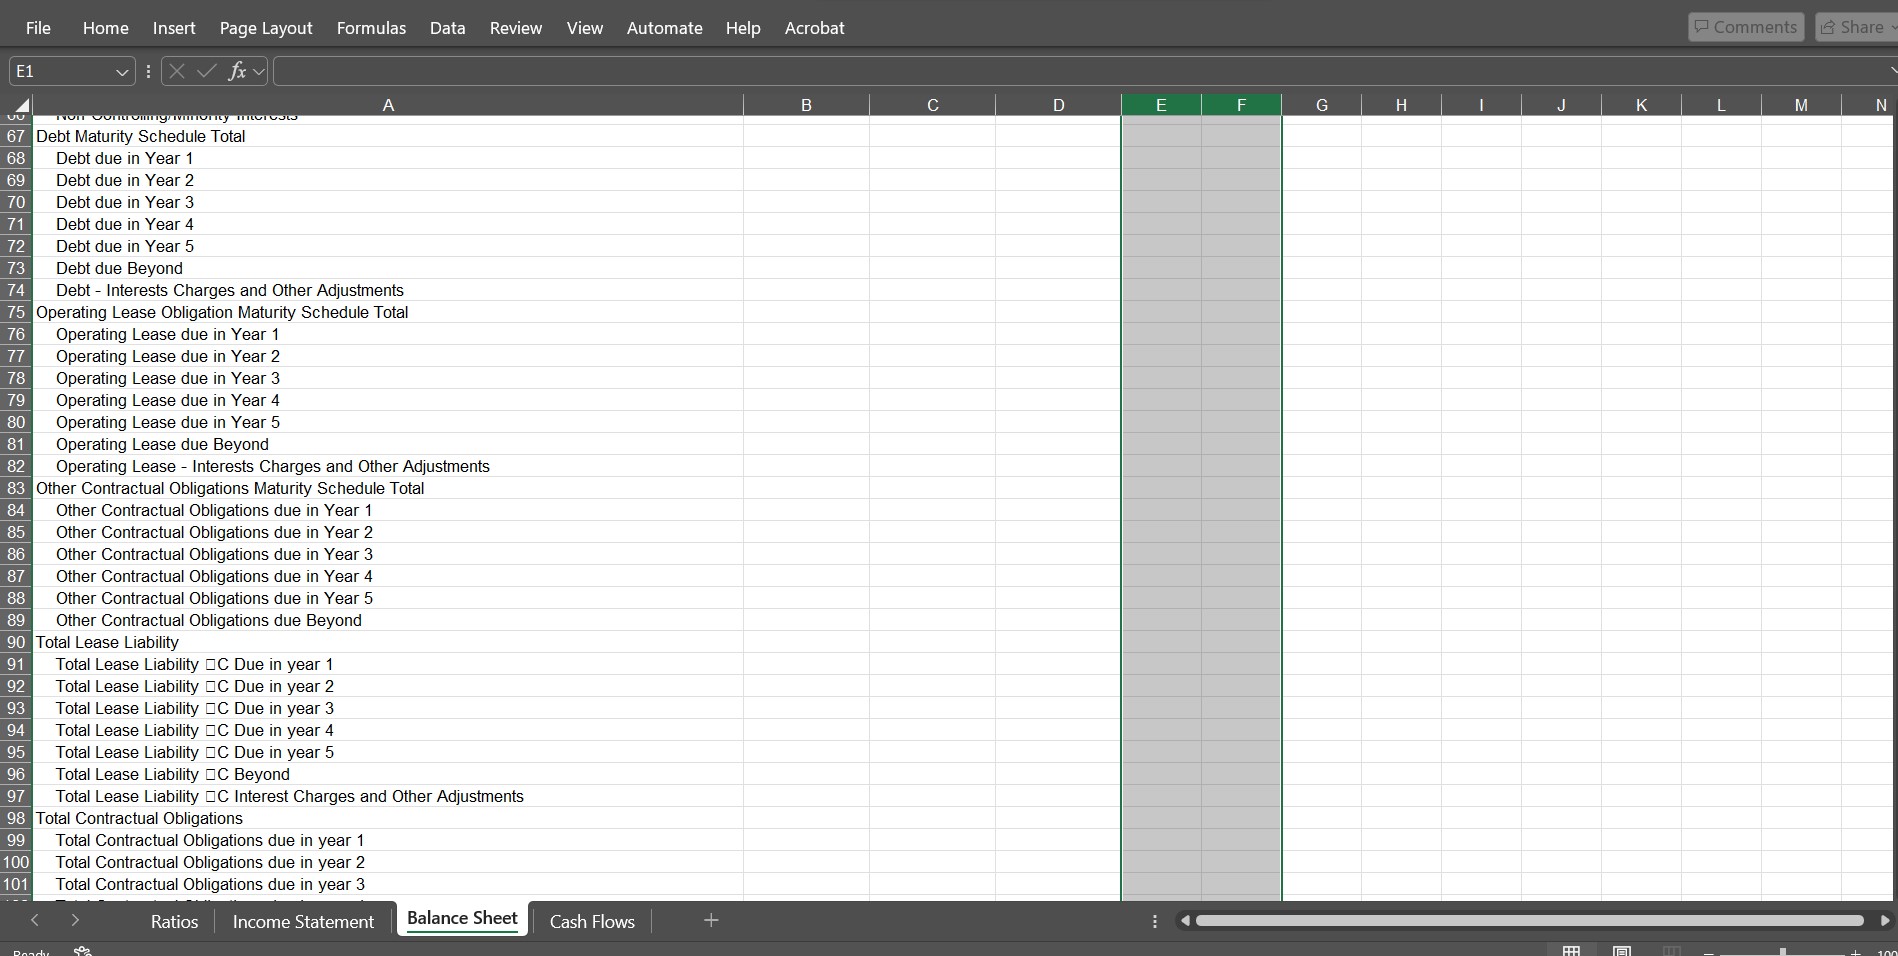
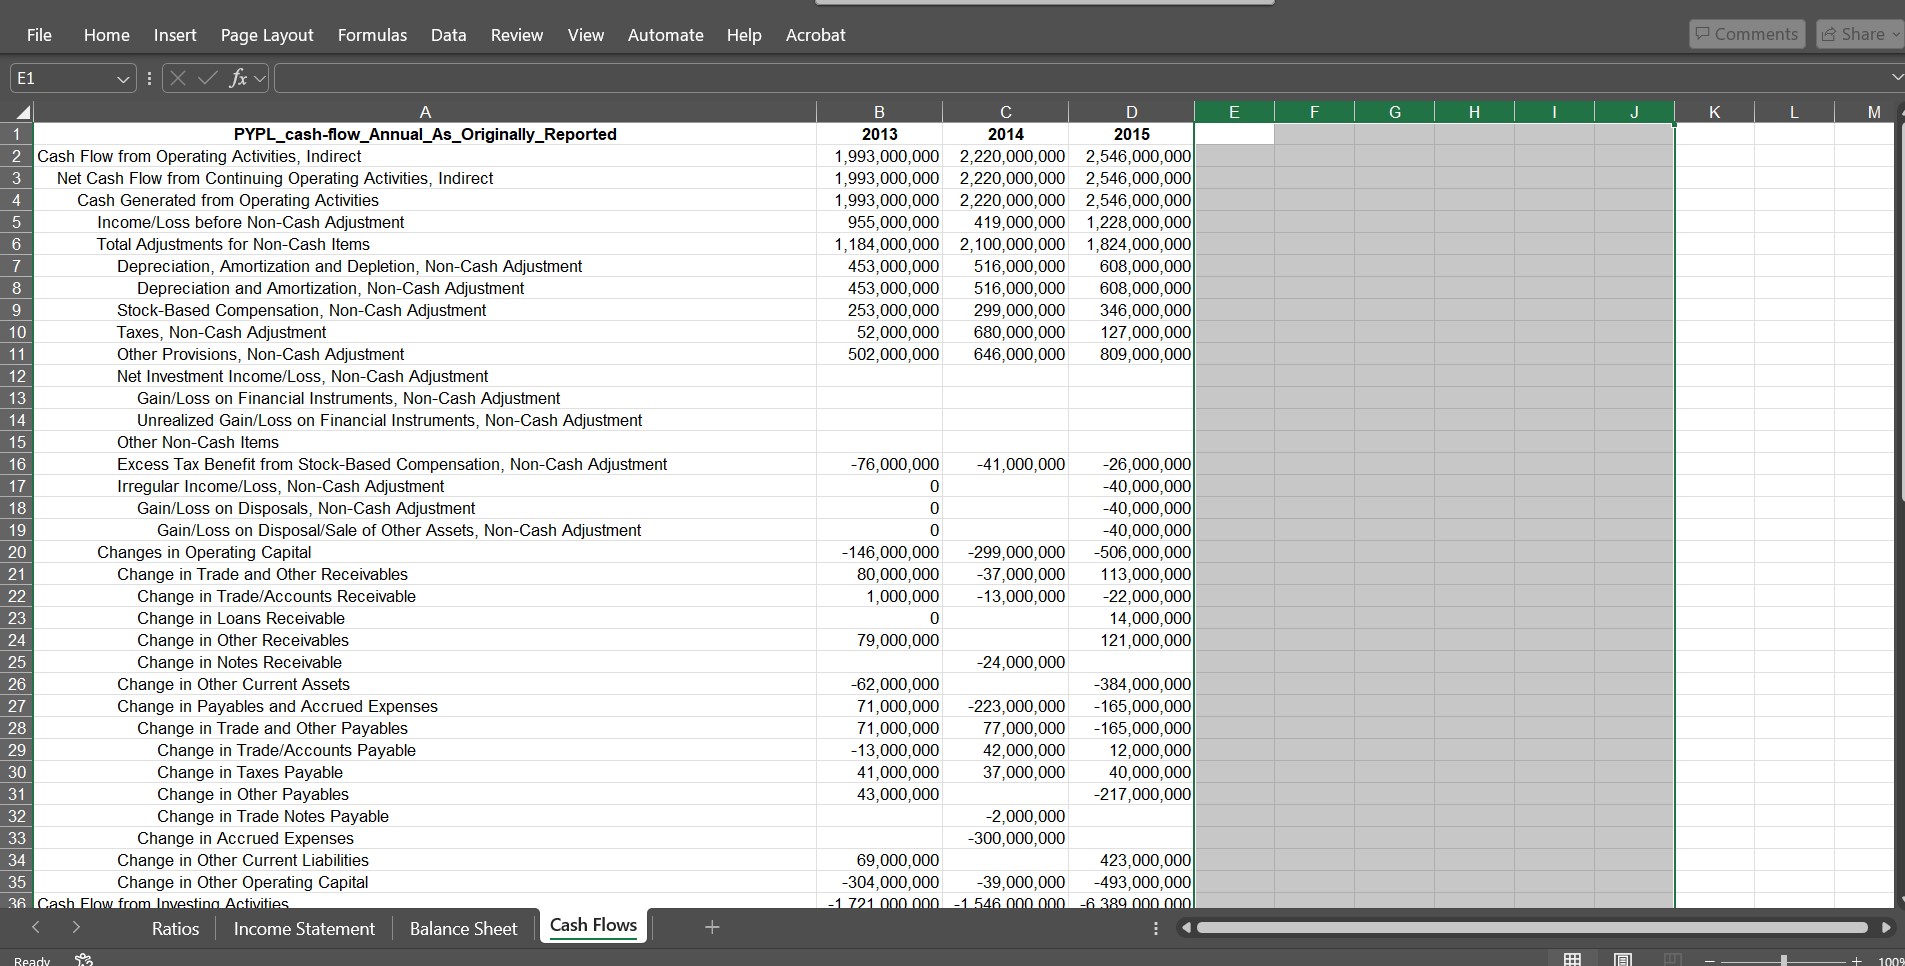
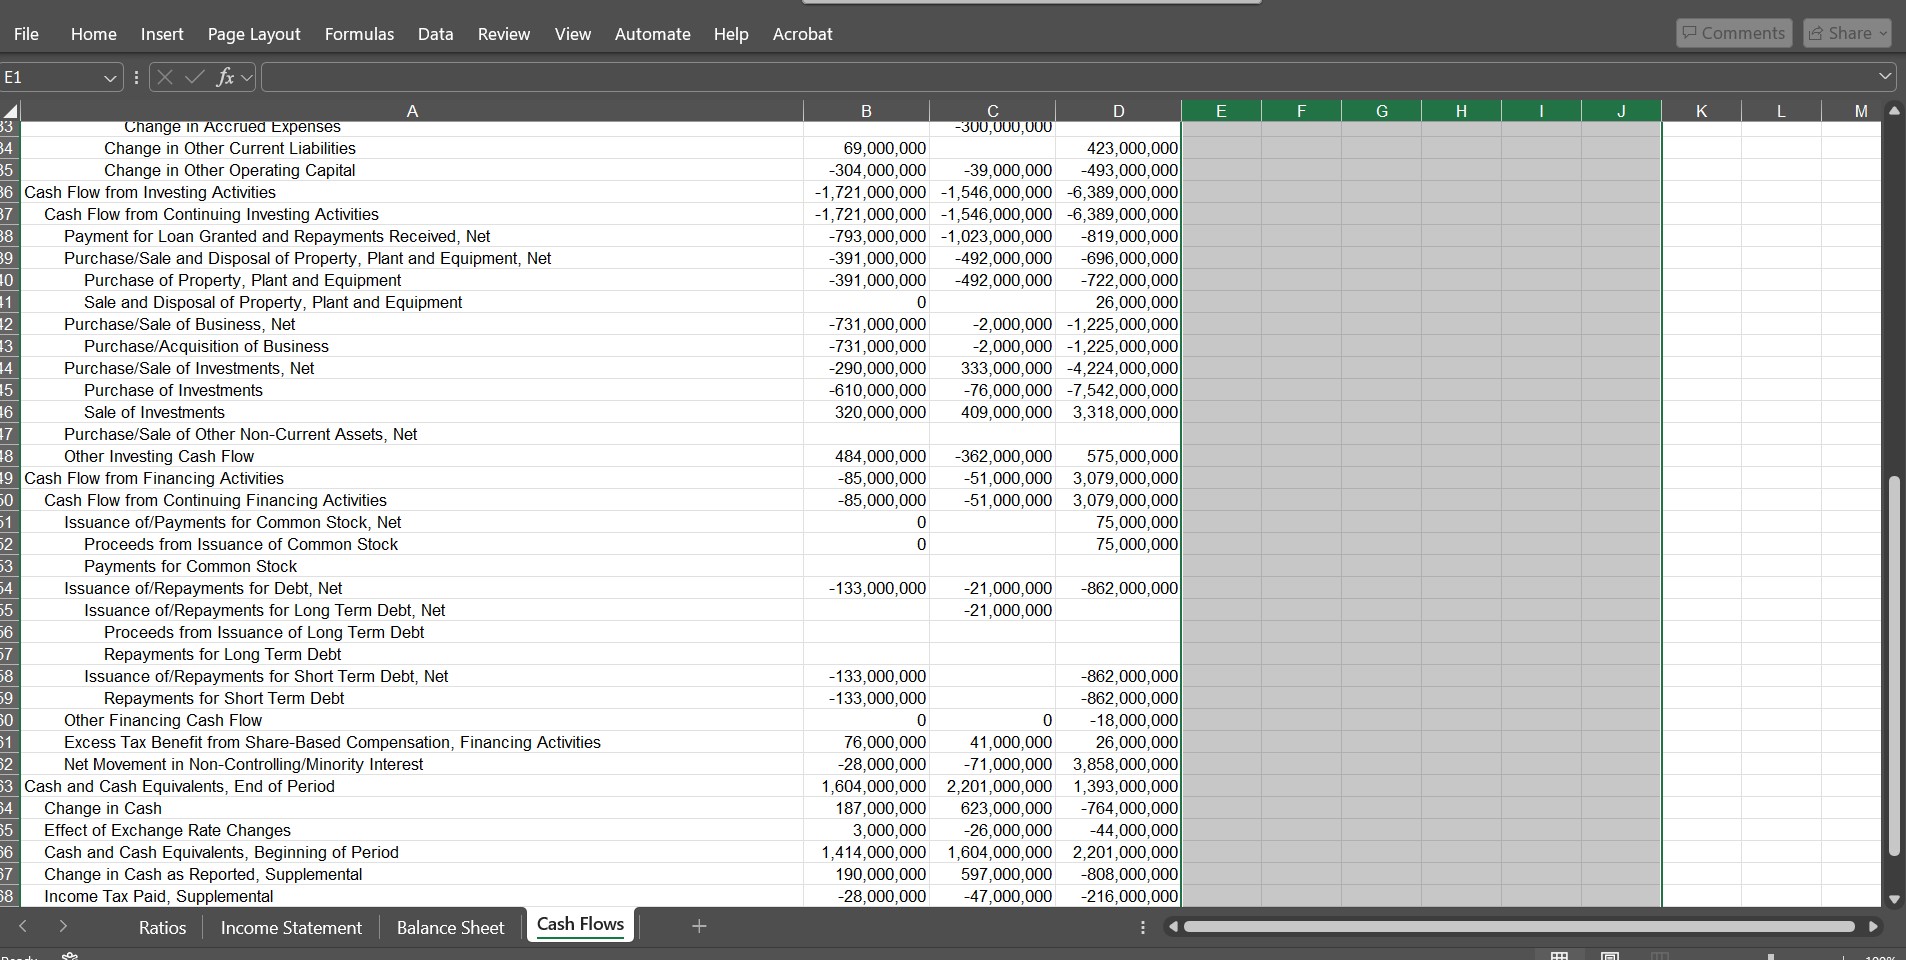
File Home Insert Page Layout Formulas Data Review View Automate Help Acrobat Comments 1 Share ~ B3 vilXV fav =SUM( ' Income Statement ' !B2/' Income Statement' !B3) B C D E G H J K M N O P Q R S 2013 2014 2015 FORMULA 2 PROFITABILITY RATIOS 3 PYPL GROSS MARGIN 65.26% 64.91% 63.03% Gross Profit / Sales 5 PYPL OPERATION MARGIN 6 PYPL NETPROFIT MARGIN 9 10 LIQUIDITY RATIO 11 PYPL CURRENT RATIO 12 3 PYPL CASH RATIO 14 15 LEVERAGE RATIOS 16 PYPL DEBT TO EQUITY 17 18 OPERATION RETURNS 19 PYPL ROE 20 21 PYPL ROA 22 23 24 35 > Ratios Income Statement Balance Sheet Cash Flows + Ready 100%File Home |Insert Pagelayout Formulas Data Review View Automate Help Acrobat 5 PYPL_income-statement_Annual_As_Originally_Reported 2013 2014 2015 Gross Profit 4,390,000,000 5,209,000,000 5,829,000,000 Total Revenue 6,727,000,000 8,025,000,000 9,248,000,000 Business Revenue 6,727,000,000 8,025,000,000 9,248,000,000 Cost of Revenue -2,337,000,000 -2,816,000,000 -3,419,000,000] Cost of Goods and Services -2,337,000,000 -2,816,000,000 -3,419,000,000 Other Cost of Revenue Operating Income/Expenses -3,299,000,000 -3,941,000,000 -4,320,000,000 Selling, General and Administrative Expenses -2,119,000,000 -2,535,000,000 -2,765,000,000 General and Administrative Expenses -1,328,000,000 -1,537,000,000 -1,780,000,000| Selling and Marketing Expenses -791,000,000 -998,000,000 -985,000,000 Research and Development Expenses -727,000,000 -890,000,000 -947,000,000| Depreciation, Amortization and Depletion -453,000,000 -516,000,000 -608,000,000| Depreciation and Amortization -453,000,000 -516,000,000 -608,000,000 Total Operating Profit/Loss 1,091,000,000 1,268,000,000 1,509,000,000 Non-Operating Income/Expenses, Total -7,000,000 -7,000,000 -21,000,000| Total Net Finance Income/Expense Net Interest Income/Expense Interest Expense Net of Capitalized Interest Interest Income Net Investment Income Gain/Loss on Investments and Other Financial Instruments Irregular Income/Expenses 0 o -48,000,000 Restructuring and Reorganization Income/Expense 0 0 -48,000,000| Other Income/Expense, Non-Operating -7,000,000 -7,000,000 27,000,000 Pretax Income 1,084,000,000 1,261,000,000 1,488,000,000 Provision for Income Tax -129,000,000 -842,000,000 -260,000,000| Net Income from Continuing Operations 955,000,000 419,000,000 1,228,000,000] Net Income after Extraordinary Items and Discontinued Operations 955,000,000 419,000,000 1,228,000,000 Net Income after Non-Controlling/Minority Interests 955,000,000 419,000,000 1,228,000,000 Net Income Available to Common Stockholders 955,000,000 419,000,000 1,228,000,000] Diluted Net Income Available to Common Stockholders 955,000,000 419,000,000 1,228,000,000 Total Revenue as Reported, Supplemental 6,727,000,000 8,025,000,000 9,248,000,000 Operating Expense as Reported, Supplemental -5,836,000,000 -6,757,000,000 -7,787,000,000| Total Operating Profit/Loss as Reported, Supplemental B od Effoctive Tax Rate Income Statement 1,091,000,000 1,268,000,000 1,461,000,000 0 Q 0 Ratios Balance Sheet (o=t R T i & 4 File Home Insert Pagelayout Formulas Data Review View Automate Help Acrobat Operating -7,000,000 -7,000,000 0 0 Pretax Income 1,084,000,000 1,261,000,000 1,488,000,000 Provision for Income Tax -129,000,000 -842,000,000 -260,000,000 Net Income from Continuing Operations 955,000,000 419,000,000 1,228,000,000] Net Income after Extraordinary Items and Discontinued Operations 955,000,000 419,000,000 1,228,000,000 Net Income after Non-Controlling/Minority Interests 955,000,000 419,000,000 1,228,000,000 Net Income Available to Common Stockholders 955,000,000 419,000,000 1,228,000,000 Diluted Net Income Available to Common Stockholders 955,000,000 419,000,000 1,228,000,000 Total Revenue as Reported, Supplemental 6,727,000,000 8,025,000,000 9,248,000,000 Operating Expense as Reported, Supplemental -5,636,000,000 -6,757,000,000 -7,787,000,000| Total Operating Profit/Loss as Reported, Supplemental 1,091,000,000 1,268,000,000 1,461,000,000 Reported Effective Tax Rate 0.119 0.67 0.175 Reported Normalized Income 1,186,000,000 1,343,000,000 1,588,000,000 Reported Normalized Operating Profit 1,411,000,000 1,648,000,000 1,975,000,000 Basic EPS 031 1.00 Basic EPS from Continuing Operations 0.31 1.00 Diluted EPS 0.31 1.00 Diluted EPS from Continuing Operations 0.31 1.00 Basic Weighted Average Shares Outstanding 1,251,000,000 1,222,000,000 Diluted Weighted Average Shares Outstanding 1,262,000,000 1,229,000,000 Reported Normalized Diluted EPS 1.10 1.29 Basic EPS 0.31 1.00, Diluted EPS 0.31 1.00, Basic WASO 1,251,000,000 1,222,000,000] Diluted WASO 1,262,000,000 1,229,000,000 Fiscal year ends in Dec 31 | USD Ratios | [llsdiileicuioudl Balance Sheet | Cash Flows File Home |Insert Pagelayout Formulas Data Review View Automate Help Acrobat A PYPL_balance-sheet_Annual_As_Originally_Reported 2013 2014 2015 19,160,000,000 21,917,000,000 28,881,000,000 Total Current Assets 14,620,000,000 17,565,000,000 20,648,000,000 Cash, Cash Equivalents and Short Term Invesiments 1,925,000,000 2,230,000,000 3,411,000,000| Cash and Cash Equivalents 1,604,000,000 2,201,000,000 1,393,000,000 Short Term Investments 321,000,000 29,000,000 2,018,000,000/ Trade and Other Receivables, Current 12,428,000,000 14,957,000,000 16,582 000,000 Trade/Accounts Receivable, Current 9,329,000,000 10,677,000,000 12,398,000,000 Loans Receivable, Current 2,789,000,000 3,586,000,000 4,184 000,000 Notes Receivable, Current 310,000,000 694,000,000 0] Prepayments and Deposits, Current 655,000,000 Other Current Assets 267,000,000 378,000,000 Total Non-Current Assets 4,540,000,000 4,352,000,000 8,233,000,000) Net Property, Plant and Equipment 858,000,000 922,000,000 1,344,000,000| Gross Property, Plant and Equipment 2,403,000,000 2,862,000,000 3,849,000,000 Properties 328,000,000 348,000,000 649,000,000 Land and Improvements 162,000,000 162,000,000 Leasehold and Improvements 166,000,000 186,000,000 Buildings and Improvements Machinery, Furniture and Equipment 1,883,000,000 2,350,000,000 Furniture, Fixtures and Office Equipment 1,983,000,000 2,350,000,000 Construction in Progress and Advance Payments 92 000,000 164,000,000 Accumulated Depreciation and Impairment 1,545,000,000 -1,940,000,000 -2,505,000,000 Accumulated Depreciation 1,545,000,000 -1,940,000,000 -2,505,000,000 Net Intangible Assets 3,445,000,000 3,345,000,000 4,427,000,000) Gross Goodwill and Other Intangible Assets. 4,185,000,000 4,162,000,000 5,359,000,000) Goodwill 3,187,000,000 3,189,000,000 4,069,000,000) Intangibles other than Goodwill 998,000,000 973,000,000 1,290,000,000| Software and Technology 169,000,000 167,000,000 245,000,000 Other Intangible Assets 829,000,000 806,000,000 1,045,000,000| Accumulated Amortization and Impairment -740,000,000 -817,000,000 -932,000,000 Accumulated Amortization of Intangible Assets -740,000,000 -817,000,000 -932,000,000] Accumulated Amortization of Intangibles other than Goodwill -740,000,000 -817,000,000 -932,000,000 Accumulated Amortization of Software and Technology -136,000,000 -153,000,000 -176,000,000] Accumulated Amortization of Other Intangible Assets -604,000,000 -664,000,000 -756,000,000] 0 0 4 erm lnyestmen q 0 Ratios Income Statement | JERICINCIICEN Cash Flows Home Insert Pagelayout Formulas Data Review View Automate f Accumulated Amortization of Intangible Assets Accumulated Amortization of Intangibles other than Goodwill Accumulated Amortization of Software and Technology Accumulated Amortization of Other Intangible Assets Total Long Term Investments Other Non-Current Assets Total Current Liabilities Payables and Accrued Expenses, Current Trade and Other Payables, Current Trade/Accounts Payable, Current Taxes Payable, Current Accrued Expenses, Current Financial Liabilities, Current Current Debt and Capital Lease Obligation Current Debt Notes Payable, Current Debt Total Non-Current Liabilities Financial Liabilities, Non-Current Long Term Debt and Capital Lease Obligation Long Term Debt Tax Liabilities, Non-Current Deferred Tax Liabilities, Non-Current Equity Attributable to Parent Stockholders Paid in Capital Capital Stock Common Stock Preferred Stock Additional Paid in Capital/Share Premium Treasury Stock Retained Earnings/Accumulated Deficit Reserves/Accumulated Comprehensive Income/Losses Other Equity Interest Non-Controlling/Minarity Interests Ratios | Income Statement | [EEIGEULIS | Cash Flows Help Acrobat -740,000,000 740,000,000 -136,000,000 -604,000,000 196,000,000 41,000,000 11,770,000,000 11,261,000,000 10,158,000,000 9,387,000,000 9,350,000,000 37,000,000 771,000,000 1,103,000,000 1,103,000,000 1,103,000,000 1,103,000,000 509,000,000 509,000,000 509,000,000 509,000,000 7,390,000,000 7,390,000,000 -61,000,000 7,451,000,000 -817,000,000 -817.000,000 -153,000,000 -664,000,000 31,000,000 54,000,000 13,669,000,000 13,283,000,000 12,190,000,000 10,756,000,000 10,727,000,000 29,000,000 1,434,000,000 1,093,000,000 1,093,000,000 1,093,000,000 1,093,000,000 386,000,000 386,000,000 386,000,000 386,000,000 8,248,000,000 8,248,000,000 110,000,000 8,138,000,000 -932,000,000 -932,000,000 -176,000,000 -756,000,000 2,348,000,000 114,000,000 15,122,000,000, 13,617,000,000, 13,617,000,000, 12,438,000,000, 12,406,000,000, 32,000,000 1,179,000,000 0 0 0 0 1,505,000,000 1,505,000,000 1,505,000,000 13,759,000,000, 13,759,000,000, 13,100,000,000, 13,100,000,000, 0 13,100,000,000 668,000,000 -9,000,000 0| File Home Insert Page Layout Formulas Data Review View Automate Help Acrobat b3 (51| Debt Maturity Schedule Total Debt due in Year 1 Debt due in Year 2 Debt due in Year 3 Debt due in Year 4 Debt due in Year 5 Debt due Beyond Debt - Interests Charges and Other Adjustments Operating Lease Obligation Maturity Schedule Total Operating Lease due in Year 1 Operating Lease due in Year 2 Operating Lease due in Year 3 Operating Lease due in Year 4 Operating Lease due in Year 5 Operating Lease due Beyond Operating Lease - Interests Charges and Other Adjustments Other Contractual Obligations Maturity Schedule Total Other Contractual Obligations due in Year 1 Other Contractual Obligations due in Year 2 Other Contractual Obligations due in Year 3 Other Contractual Obligations due in Year 4 Other Contractual Obligations due in Year 5 Other Contractual Obligations due Beyond Total Lease Liability Total Lease Liabili in year 1 Total Lease Lial year 2 Total Lease Lial year 3 Total Lease Lial year 4 Total Lease Lia OC Due in year 5 Total Lease Liability TC Beyond Total Lease Liability OC Interest Charges and Other Adjustments Total Contractual Obligations Total Contractual Obligations due in year 1 Total Contractual Obligations due in year 2 Total Contractual Obligations due in year 3 Ratios | Income Statement | [lcliaditaad Cash Flows Home Insert 510 Page Layout Formulas R Data Review View Automate PYPL_cash-flow_Annual_As_Originally_Reported Cash Flow from Operating Activities, Indirect Net Cash Flow from Continuing Operating Activities, Indirect Cash Generated from Operating Activities Income/Loss before Non-Cash Adjustment Total Adjustments for Non-Cash ltems Depreciation, Amortization and Depletion, Non-Cash Adjustment Depreciation and Amortization, Non-Cash Adjustment Stock-Based Compensation, Non-Cash Adjustment Taxes, Non-Cash Adjustment Other Provisions, Non-Cash Adjustment Net Investment Income/Loss, Non-Cash Adjustment Gain/Loss on Finangial Instruments, Non-Cash Adjustment Unrealized Gain/Loss on Financial Instruments, Non-Cash Adjustment Other Non-Cash Items Excess Tax Benefit from Stock-Based Compensation, Non-Cash Adjustment Irregular Income/Loss, Non-Cash Adjustment Gain/Loss on Disposals, Non-Cash Adjustment Gain/Loss on Disposal/Sale of Other Assets, Non-Cash Adjustment Changes in Operating Capital Change in Trade and Other Receivables Change in Trade/Accounts Receivable Change in Loans Receivable Change in Other Receivables Change in Notes Receivable Change in Other Current Assets Change in Payables and Accrued Expenses Change in Trade and Other Payables Change in Trade/Accounts Payable Change in Taxes Payable Change in Other Payables Change in Trade Notes Payable Change in Accrued Expenses Change in Other Current Liabilities Change in Other Operating Capital Income Statement Balance Sheet Help age kL 2013 1,893,000,000 1,893,000,000 1,993,000,000 955,000,000 1,184,000,000 453,000,000 453,000,000 253,000,000 52,000,000 502,000,000 ~76,000,000 0 0 0 -146,000,000 80,000,000 1,000,000 0 79,000,000 -62,000,000 71,000,000 71,000,000 ~13,000,000 41,000,000 43,000,000 69,000,000 -304,000,000 2014 2,220,000,000 2,220,000,000 2,220,000,000 419,000,000 2,100,000,000 516,000,000 516,000,000 299,000,000 680,000,000 646,000,000 -41,000,000 -299,000,000 -37,000,000 -13,000,000 -24,000,000 -223 000,000 77,000,000 42,000,000 37,000,000 -2,000,000 -300,000,000 -39,000,000 2015 2,546,000,000| 2,546,000,000 2,546,000,000) 1,228,000,000) 1,824,000,000) 608,000,000 608,000,000 346,000,000 127,000,000 809,000,000 -26,000,000 -40,000,000 -40,000,000) -40,000,000) -506,000,000] 113,000,000 -22,000,000) 14,000,000 121,000,000 -384,000,000| -165,000,000| -165,000,000| 12,000,000 40,000,000 -217,000,000| 423,000,000 File Home Insert Pagelayout Formulas Data Review View Automate Help Change in Other Current Liabilities Change in Other Operating Capital Cash Flow from Investing Activities Cash Flow from Continuing Investing Activities Payment for Loan Granted and Repayments Received, Net Purchase/Sale and Disposal of Property, Plant and Equipment, Net Purchase of Property, Plant and Equipment Sale and Disposal of Property, Plant and Equipment Purchase/Sale of Business, Net PurchasefAcquisition of Business Purchase/Sale of Investments, Net Purchase of Investments Sale of Investments Purchase/Sale of Other Non-Current Assets, Net Other Investing Cash Flow Cash Flow from Financing Activities Cash Flow from Continuing Financing Activities Issuance of/Payments for Common Stock, Net Proceeds from Issuance of Common Stock Payments for Common Stock Issuance of/Repayments for Debt, Net Issuance of/Repayments for Long Term Debt, Net Proceeds from Issuance of Long Term Debt Repayments for Long Term Debt Issuance of/Repayments for Short Term Debt, Net Repayments for Short Term Debt Other Financing Cash Flow Excess Tax Benefit from Share-Based Compensation, Financing Activities Net Movement in Non-Controlling/Minority Interest Cash and Cash Equivalents, End of Period Change in Cash Effect of Exchange Rate Changes Cash and Cash Equivalents, Beginning of Period Change in Cash as Reported, Supplemental Income Tax Paid, Supplemental Ratios | Income Statement | Balance Sheet faGLE 69,000,000 304,000,000 -1,721,000,000 -1,721,000,000 ~793,000,000 391,000,000 391,000,000 0 731,000,000 731,000,000 290,000,000 610,000,000 320,000,000 484,000,000 85,000,000 -85,000,000 0 0 133,000,000 -133,000,000 133,000,000 0 76,000,000 -28,000,000 1,604,000,000 187,000,000 3,000,000 1,414,000,000 190,000,000 -28,000,000 39,000,000 -1,546,000,000 ~1,546,000,000 -1,023,000,000 492,000,000 492,000,000 -2,000,000 -2,000,000 333,000,000 ~76,000,000 409,000,000 -362,000,000 51,000,000 -51,000,000 -21,000,000 21,000,000 0 41,000,000 71,000,000 2,201,000,000 623,000,000 -26,000,000 1,604,000,000 597,000,000 -47,000,000 423,000,000 493,000,000 -6,389,000,000 -6,389,000,000 -819,000,000) 696,000,000 722,000,000 26,000,000 -1,225,000,000 -1,225,000,000 -4,224,000,000 ~7,542,000,000 3,318,000,000 575,000,000 3,079,000,000 3,079,000,000 75,000,000 75,000,000 862,000,000 -862,000,000) -862,000,000) -18,000,000 26,000,000 3,858,000,000 1,393,000,000 ~764,000,000) -44,000,000 2,201,000,000) -808,000,000| -216,000,000)
Step by Step Solution
There are 3 Steps involved in it

Get step-by-step solutions from verified subject matter experts