

Question: Fill in and answer the colored cells begin{tabular}{|c|c|c|c|} hline A & B & C & D hline multicolumn{4}{|l|}{ Newsvendor Model } hline &
Fill in and answer the colored cells
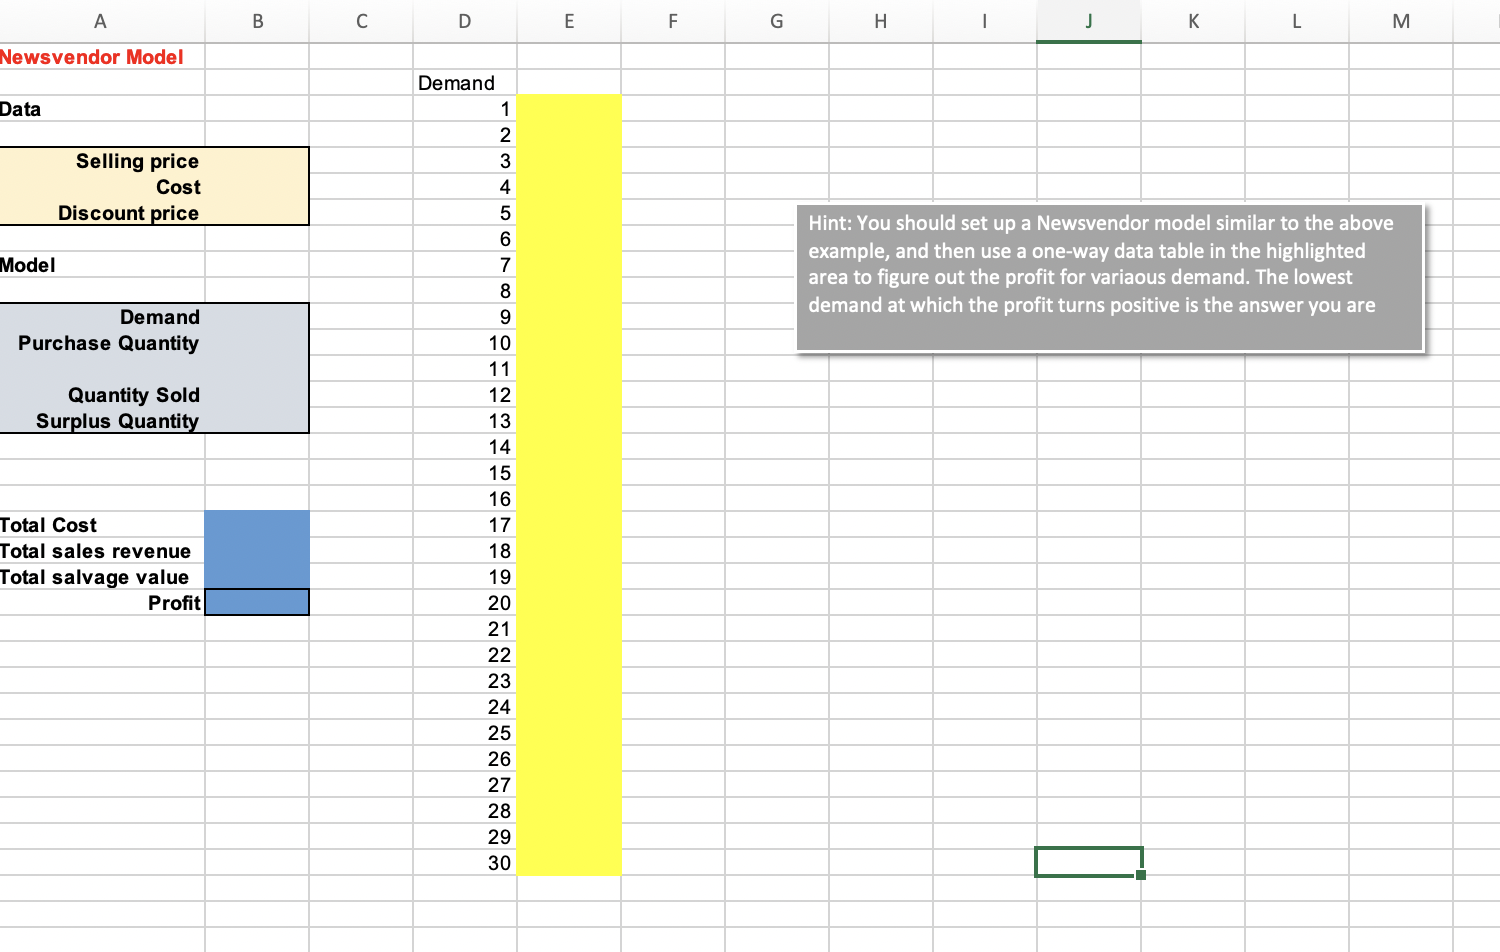
\begin{tabular}{|c|c|c|c|} \hline A & B & C & D \\ \hline \multicolumn{4}{|l|}{ Newsvendor Model } \\ \hline & & & Demand \\ \hline \multirow{2}{*}{ Data } & & & 1 \\ \hline & & & 2 \\ \hline \multirow{3}{*}{\multicolumn{2}{|c|}{\begin{tabular}{r} Selling price \\ Cost \\ Discount price \end{tabular}}} & & 3 \\ \hline & & & 4 \\ \hline & & & 5 \\ \hline & & & 6 \\ \hline \multirow{2}{*}{ Model } & & & 7 \\ \hline & & & 8 \\ \hline \multirow{3}{*}{\begin{tabular}{r} Demand \\ Purchase Quantity \end{tabular}} & & & 9 \\ \hline & & & 10 \\ \hline & & & 11 \\ \hline \multirow{5}{*}{\begin{tabular}{r} Quantity Sold \\ Surplus Quantity \\ \end{tabular}} & & & 12 \\ \hline & & & 13 \\ \hline & & & 14 \\ \hline & & & 15 \\ \hline & & & 16 \\ \hline Total Cost & & & 17 \\ \hline \multirow{2}{*}{\begin{tabular}{l} Total Cost \\ Total sales revenue \\ Total salvage value \end{tabular}} & & & 18 \\ \hline & & & 19 \\ \hline \multirow[t]{11}{*}{ Profit } & & & 20 \\ \hline & & & 21 \\ \hline & & & 22 \\ \hline & & & 23 \\ \hline & & & 24 \\ \hline & & & 25 \\ \hline & & & 26 \\ \hline & & & 27 \\ \hline & & & 28 \\ \hline & & & 29 \\ \hline & & & 30 \\ \hline \end{tabular} Hint: You should set up a Newsvendor model similar to the above example, and then use a one-way data table in the highlighted area to figure out the profit for variaous demand. The lowest demand at which the profit turns positive is the answer you are \begin{tabular}{|c|c|c|c|} \hline A & B & C & D \\ \hline \multicolumn{4}{|l|}{ Newsvendor Model } \\ \hline & & & Demand \\ \hline \multirow{2}{*}{ Data } & & & 1 \\ \hline & & & 2 \\ \hline \multirow{3}{*}{\multicolumn{2}{|c|}{\begin{tabular}{r} Selling price \\ Cost \\ Discount price \end{tabular}}} & & 3 \\ \hline & & & 4 \\ \hline & & & 5 \\ \hline & & & 6 \\ \hline \multirow{2}{*}{ Model } & & & 7 \\ \hline & & & 8 \\ \hline \multirow{3}{*}{\begin{tabular}{r} Demand \\ Purchase Quantity \end{tabular}} & & & 9 \\ \hline & & & 10 \\ \hline & & & 11 \\ \hline \multirow{5}{*}{\begin{tabular}{r} Quantity Sold \\ Surplus Quantity \\ \end{tabular}} & & & 12 \\ \hline & & & 13 \\ \hline & & & 14 \\ \hline & & & 15 \\ \hline & & & 16 \\ \hline Total Cost & & & 17 \\ \hline \multirow{2}{*}{\begin{tabular}{l} Total Cost \\ Total sales revenue \\ Total salvage value \end{tabular}} & & & 18 \\ \hline & & & 19 \\ \hline \multirow[t]{11}{*}{ Profit } & & & 20 \\ \hline & & & 21 \\ \hline & & & 22 \\ \hline & & & 23 \\ \hline & & & 24 \\ \hline & & & 25 \\ \hline & & & 26 \\ \hline & & & 27 \\ \hline & & & 28 \\ \hline & & & 29 \\ \hline & & & 30 \\ \hline \end{tabular} Hint: You should set up a Newsvendor model similar to the above example, and then use a one-way data table in the highlighted area to figure out the profit for variaous demand. The lowest demand at which the profit turns positive is the answer you are
Step by Step Solution
There are 3 Steps involved in it

Get step-by-step solutions from verified subject matter experts