

Question: I ALREADY HAVE THE ANSWER FOR SECTION A I JUST NEED SECTION B AND C Following is information for the required returns and standard deviations
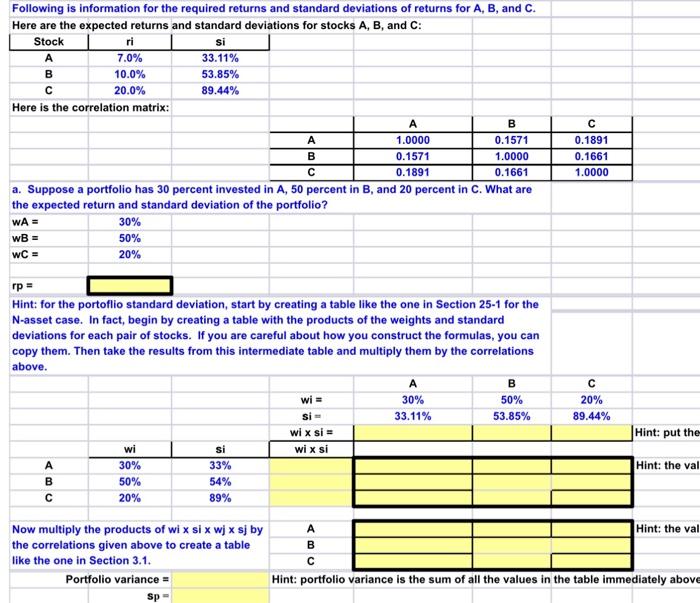
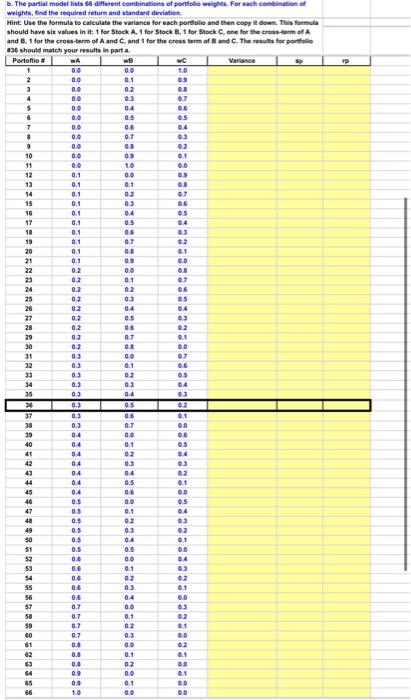
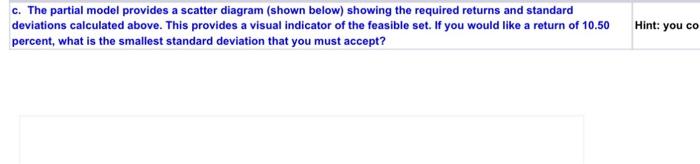
Following is information for the required returns and standard deviations of returns for A, B, and C. Here are the expected returns and standard deviations for stocks A, B, and C: \begin{tabular}{|c|c|c|} \hline Stock & ri & si \\ \hline A & 7.0% & 33.11% \\ \hline B & 10.0% & 53.85% \\ \hline C & 20.0% & 89.44% \\ \hline \end{tabular} Here is the correlation matrix: \begin{tabular}{|c|c|c|c|} \hline & A & B & C \\ \hline A & 1.0000 & 0.1571 & 0.1891 \\ \hline B & 0.1571 & 1.0000 & 0.1661 \\ \hline C & 0.1891 & 0.1661 & 1.0000 \\ \hline \end{tabular} a. Suppose a portfolio has 30 percent invested in A, 50 percent in B, and 20 percent in C. What are the expected return and standard deviation of the portfolio? \begin{tabular}{|l|l|} \hlinewA= & 30% \\ \hlinewB= & 50% \\ \hlinewC= & 20% \\ \hline & \\ \hline & \\ \hline \end{tabular} Hint: for the portoflio standard deviation, start by creating a table like the one in Section 25-1 for the N-asset case. In fact, begin by creating a table with the products of the weights and standard deviations for each pair of stocks. If you are careful about how you construct the formulas, you can copy them. Then take the results from this intermediate table and multiply them by the correlations above. b. The partial modei lists 66 different cembinations of pentiolie mights. For ach comelinution of c. The partial model provides a scatter diagram (shown below) showing the required returns and standard deviations calculated above. This provides a visual indicator of the feasible set. If you would like a return of 10.50 percent, what is the smallest standard deviation that you must accept? Following is information for the required returns and standard deviations of returns for A, B, and C. Here are the expected returns and standard deviations for stocks A, B, and C: \begin{tabular}{|c|c|c|} \hline Stock & ri & si \\ \hline A & 7.0% & 33.11% \\ \hline B & 10.0% & 53.85% \\ \hline C & 20.0% & 89.44% \\ \hline \end{tabular} Here is the correlation matrix: \begin{tabular}{|c|c|c|c|} \hline & A & B & C \\ \hline A & 1.0000 & 0.1571 & 0.1891 \\ \hline B & 0.1571 & 1.0000 & 0.1661 \\ \hline C & 0.1891 & 0.1661 & 1.0000 \\ \hline \end{tabular} a. Suppose a portfolio has 30 percent invested in A, 50 percent in B, and 20 percent in C. What are the expected return and standard deviation of the portfolio? \begin{tabular}{|l|l|} \hlinewA= & 30% \\ \hlinewB= & 50% \\ \hlinewC= & 20% \\ \hline & \\ \hline & \\ \hline \end{tabular} Hint: for the portoflio standard deviation, start by creating a table like the one in Section 25-1 for the N-asset case. In fact, begin by creating a table with the products of the weights and standard deviations for each pair of stocks. If you are careful about how you construct the formulas, you can copy them. Then take the results from this intermediate table and multiply them by the correlations above. b. The partial modei lists 66 different cembinations of pentiolie mights. For ach comelinution of c. The partial model provides a scatter diagram (shown below) showing the required returns and standard deviations calculated above. This provides a visual indicator of the feasible set. If you would like a return of 10.50 percent, what is the smallest standard deviation that you must accept
Step by Step Solution
There are 3 Steps involved in it

Get step-by-step solutions from verified subject matter experts