

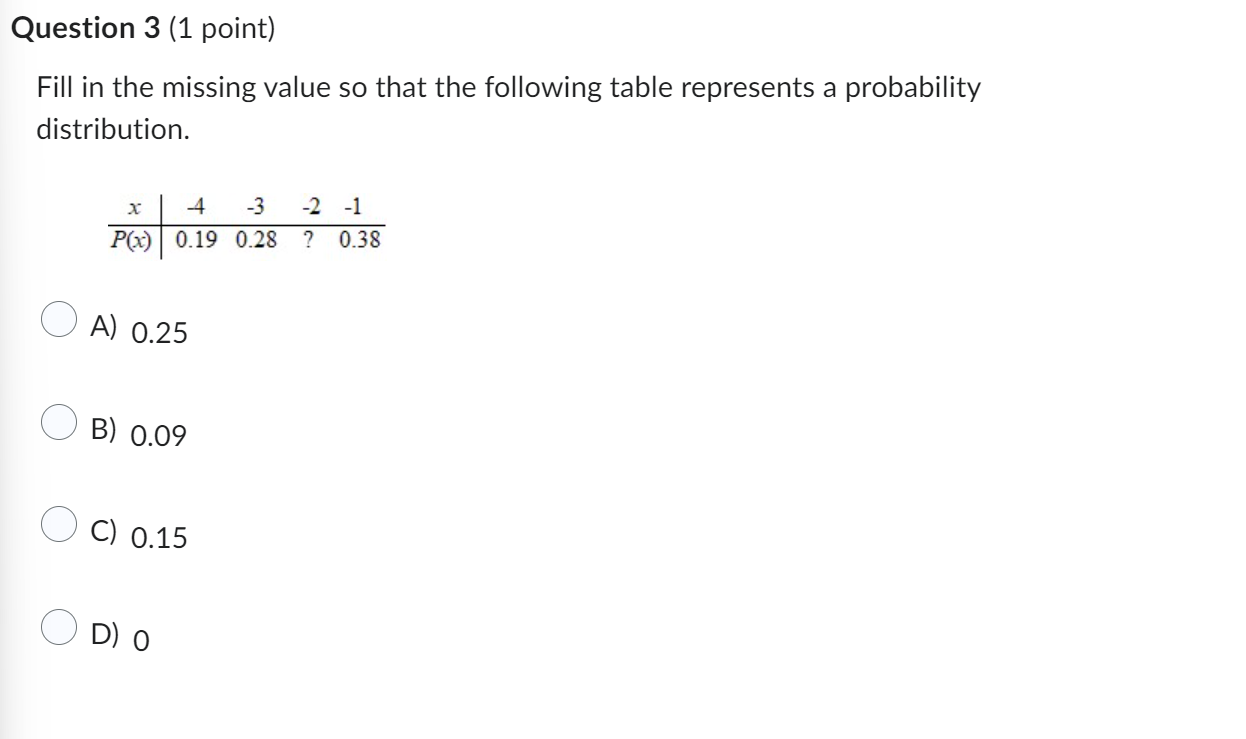
Question: Fill in the missing value so that the following table represents a probability distribution.? row chart ( (x -4 -3 -2 -1 )(P(x) 0.19 0.28
Fill in the missing value so that the following table represents a probability distribution.? row chart ( (x -4 -3 -2 -1 )(P(x) 0.19 0.28 ? 0.38) )Question 3 options:A) 0.25B) 0.09C) 0.15D) 0
Step by Step Solution
There are 3 Steps involved in it
1 Expert Approved Answer
Step: 1 Unlock

Question Has Been Solved by an Expert!
Get step-by-step solutions from verified subject matter experts
Step: 2 Unlock
Step: 3 Unlock