

Question: Fill in the table below begin { tabular } { | c | c | c | c | c | l | }
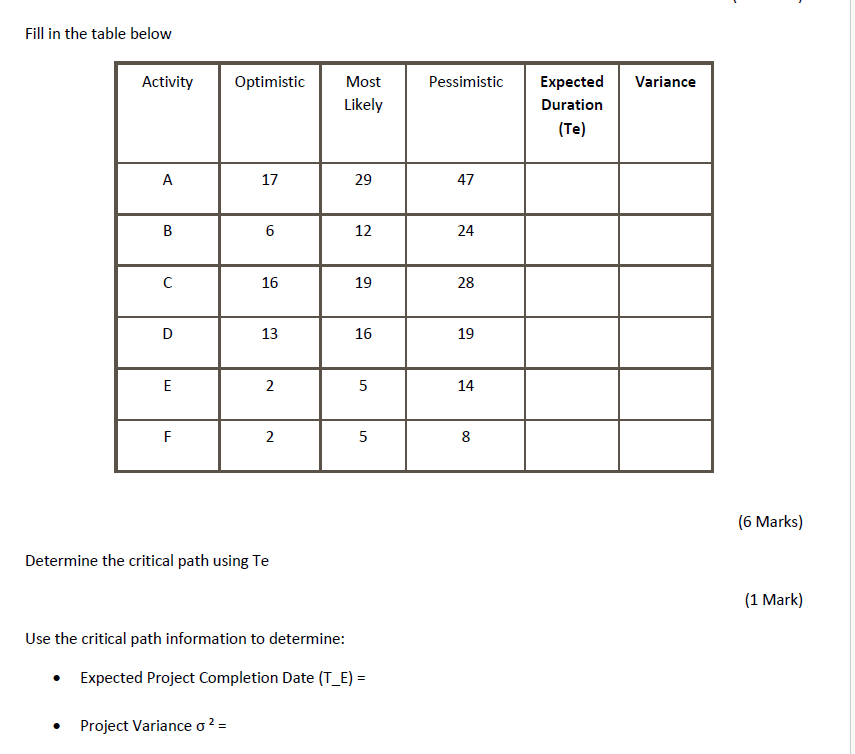
Fill in the table below
begintabularcccccl
hline Activity & Optimistic & begintabularc
Most
Likely
endtabular & Pessimistic & begintabularc
Expected
Duration
Te
endtabular & Variance
hline A & & & & &
hline B & & & & &
hline C & & & & &
hline D & & & & &
hline E & & & & &
hline F & & & & &
hline
endtabular
Marks
Determine the critical path using Te
Mark
Use the critical path information to determine:
Expected Project Completion Date TE
quad Project Variance sigma
Step by Step Solution
There are 3 Steps involved in it
1 Expert Approved Answer
Step: 1 Unlock

Question Has Been Solved by an Expert!
Get step-by-step solutions from verified subject matter experts
Step: 2 Unlock
Step: 3 Unlock