

Question: Fill in the Tables Using the Raw Data Raw Data Used Yahoo Finance Values in Millions Total Revenue Operating Income (EBIT) Income Tax Income before
Fill in the Tables Using the Raw Data
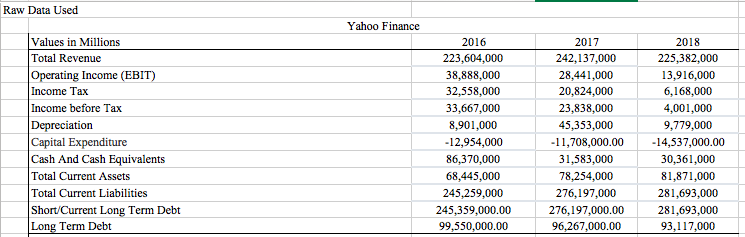
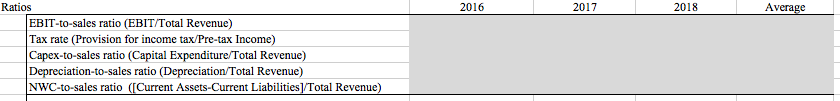
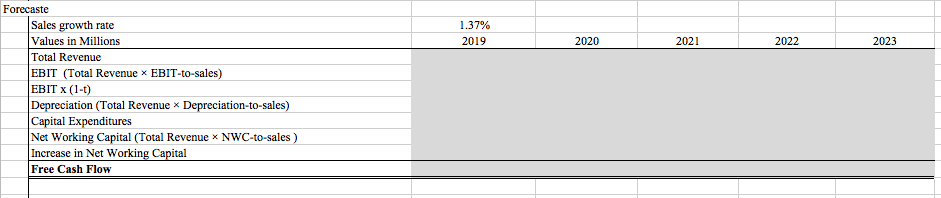
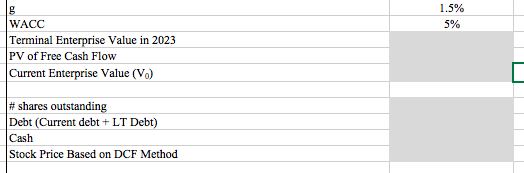
Raw Data Used Yahoo Finance Values in Millions Total Revenue Operating Income (EBIT) Income Tax Income before Tax Depreciation Capital Expenditure Cash And Cash Equivalents Total Current Assets Total Current Liabilities Short/Current Long Term Debt Long Term Debt 2016 223,604,000 38,888,000 32,558,000 33,667,000 8,901,000 -12,954,000 86,370,000 68,445,000 245,259,000 245,359,000.00 99,550,000.00 2017 2017 242,137,000 28,441,000 20,824,000 23,838,000 45,353,000 -11,708,000.00 31,583,000 78,254,000 276,197,000 276,197,000.00 96,267.000.00 2018 225,382,000 13,916,000 6,168,000 4,001,000 9,779,000 -14,537,000.00 30,361,000 81,871,000 281,693,000 281,693,000 93,117,000 2016 2017 2018 Average Ratios EBIT-to-sales ratio (EBIT/Total Revenue) Tax rate (Provision for income tax/Pre-tax Income) Capex-to-sales ratio (Capital Expenditure/Total Revenue) Depreciation-to-sales ratio (Depreciation/Total Revenue) NWC-to-sales ratio (Current Assets-Current Liabilities]/Total Revenue) 1.37% 2019 2020 2021 2022 2023 Forecaste Sales growth rate Values in Millions Total Revenue EBIT (Total Revenue x EBIT-to-sales) EBIT X (1-t) Depreciation (Total Revenue x Depreciation-to-sales) Capital Expenditures Net Working Capital (Total Revenue NWC-to-sales) Increase in Net Working Capital Free Cash Flow 1.5% 5% WACC Terminal Enterprise Value in 2023 PV of Free Cash Flow Current Enterprise Value (V.) # shares outstanding Debt (Current debt +LT Debt) Cash Stock Price Based on DCF Method Raw Data Used Yahoo Finance Values in Millions Total Revenue Operating Income (EBIT) Income Tax Income before Tax Depreciation Capital Expenditure Cash And Cash Equivalents Total Current Assets Total Current Liabilities Short/Current Long Term Debt Long Term Debt 2016 223,604,000 38,888,000 32,558,000 33,667,000 8,901,000 -12,954,000 86,370,000 68,445,000 245,259,000 245,359,000.00 99,550,000.00 2017 2017 242,137,000 28,441,000 20,824,000 23,838,000 45,353,000 -11,708,000.00 31,583,000 78,254,000 276,197,000 276,197,000.00 96,267.000.00 2018 225,382,000 13,916,000 6,168,000 4,001,000 9,779,000 -14,537,000.00 30,361,000 81,871,000 281,693,000 281,693,000 93,117,000 2016 2017 2018 Average Ratios EBIT-to-sales ratio (EBIT/Total Revenue) Tax rate (Provision for income tax/Pre-tax Income) Capex-to-sales ratio (Capital Expenditure/Total Revenue) Depreciation-to-sales ratio (Depreciation/Total Revenue) NWC-to-sales ratio (Current Assets-Current Liabilities]/Total Revenue) 1.37% 2019 2020 2021 2022 2023 Forecaste Sales growth rate Values in Millions Total Revenue EBIT (Total Revenue x EBIT-to-sales) EBIT X (1-t) Depreciation (Total Revenue x Depreciation-to-sales) Capital Expenditures Net Working Capital (Total Revenue NWC-to-sales) Increase in Net Working Capital Free Cash Flow 1.5% 5% WACC Terminal Enterprise Value in 2023 PV of Free Cash Flow Current Enterprise Value (V.) # shares outstanding Debt (Current debt +LT Debt) Cash Stock Price Based on DCF Method
Step by Step Solution
There are 3 Steps involved in it

Get step-by-step solutions from verified subject matter experts