

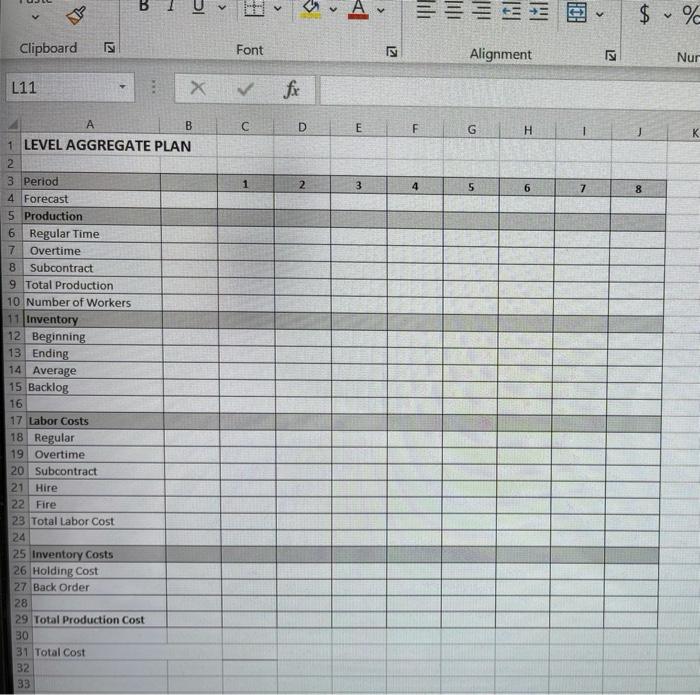
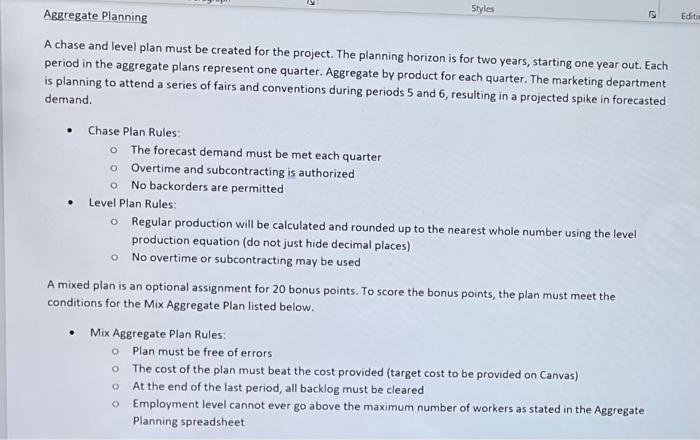
Question: fill out figure 3 using figure 1 & 2 information. please note the rules. thank you! figure 1 figure 2 figure 3 rules Value 480
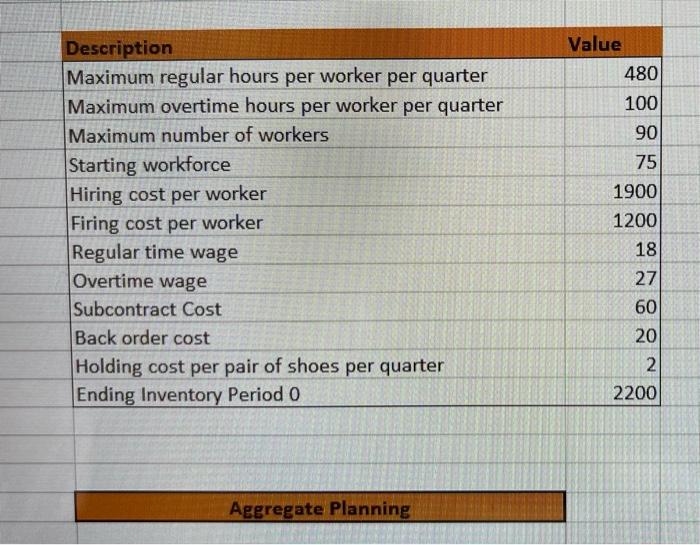
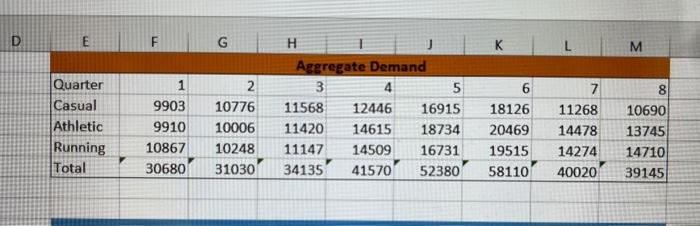
Value 480 100 90 Description Maximum regular hours per worker per quarter Maximum overtime hours per worker per quarter Maximum number of workers Starting workforce Hiring cost per worker Firing cost per worker Regular time wage Overtime wage Subcontract Cost Back order cost Holding cost per pair of shoes per quarter Ending Inventory Period 0 75 1900 1200 18 27 60 20 2 2200 Aggregate Planning E F G K L M 1 7 8 Quarter Casual Athletic Running Total 9903 9910 10867 30680 2 10776 10006 10248 31030 H Aggregate Demand 3 4 5 11568 12446 16915 11420 14615 18734 11147 14509 16731 34135 41570 52380 18126 20469 19515 58110 11268 14478 14274 40020 10690 13745 14710 39145 IC
Step by Step Solution
There are 3 Steps involved in it

Get step-by-step solutions from verified subject matter experts