

Question: fill out the second chart using the first one. Data Sheet Record from Original Bottles: 0.00200 molarity of stock KSCN (M) 0.200 molarity of Fe(NO3),
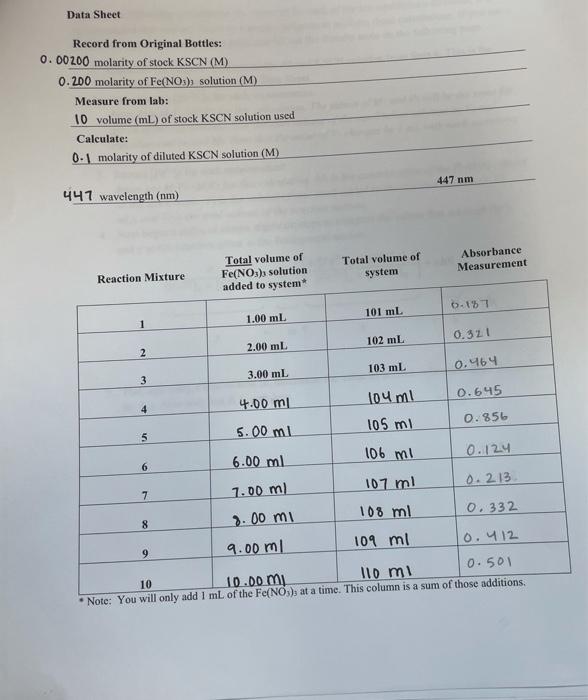

Data Sheet Record from Original Bottles: 0.00200 molarity of stock KSCN (M) 0.200 molarity of Fe(NO3), solution (M) Measure from lab: 10 volume (ml) of stock KSCN solution used Calculate: 0.1 molarity of diluted KSCN solution (M) 447 nm 441 wavelength (nm) Absorbance Measurement Total volume of system Total volume of Fe(NO3) solution added to system Reaction Mixture 0-17 101 mL 1 1.00 mL 102 mL 0.321 2.00 ml 2 103 ml 0.464 3 3 3.00 mL # 106 mi 4.00 m 104 ml 0.645 5 5.00 ml 105 mi 0.856 6 6.00 ml 0.124 7 7.00 ml 107 ml 0.213 8 8.00 mi 108 ml 0.332 9 9.00 ml 109 ml 0.412 0.50l 10 10 ml 10.00 mi Note: You will only add 1 mL of the Fe(NO3), at a time. This column is a sum of those additions 00 X Y Results A(Fe). + (SCN)) Fesilex SCN-1 Reaction Mixture [Fe [Fe] x [SCN- (SCN), 2 3 4 5 6 6 7 8 9 10 Equation of Best Fit Line R? Value Slope of Line Value of K, the Equilibrium Constant
Step by Step Solution
There are 3 Steps involved in it

Get step-by-step solutions from verified subject matter experts