

Question: Fill this worksheet and show formula too Exhibit 5: Line of Business Budget and Actual Operating Statistics: Q2 2000 Number of Consultants(FTE) Billed Hours Billed


 Fill this worksheet and show formula too
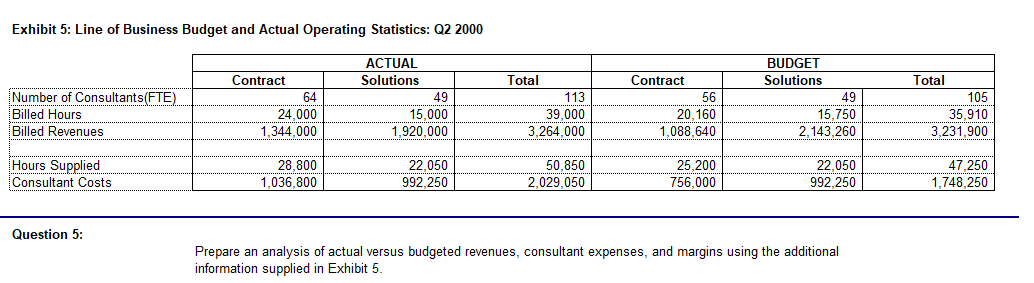
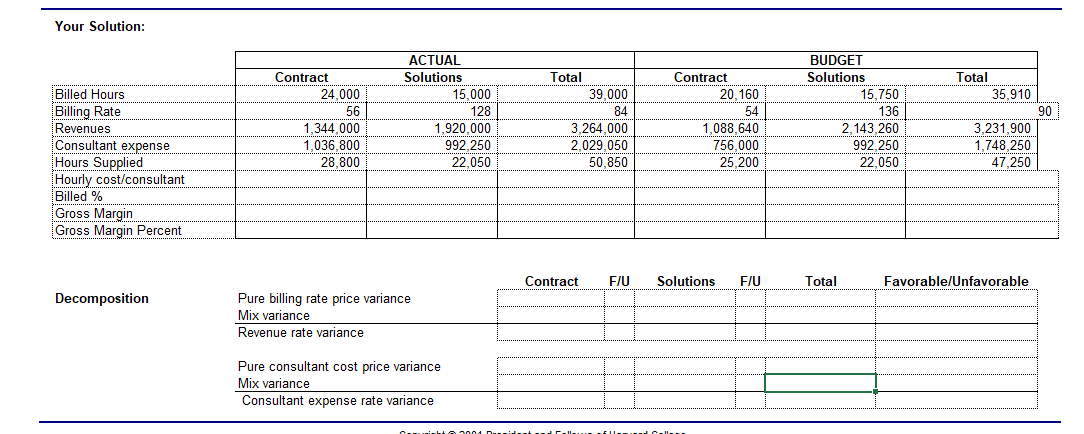
Exhibit 5: Line of Business Budget and Actual Operating Statistics: Q2 2000 Number of Consultants(FTE) Billed Hours Billed Revenues Contract 64 24.000 1,344,000 ACTUAL Solutions 49 15,000 1,920,000 Total 113 39,000 3,264,000 Contract 56 20.160 1,088,640 BUDGET Solutions 49 15,750 2,143,260 Total 105 35,910 3,231,900 Hours Supplied Consultant Costs 28.800 1.036.800 22,050 992,250 50,850 2,029,050 25,200 756,000 22,050 992,250 47.250 1,748,250 Question 5: Prepare an analysis of actual versus budgeted revenues, consultant expenses, and margins using the additional information supplied in Exhibit 5. Your Solution: Total 35,910 Billed Hours Billing Rate Revenues Consultant expense Hours Supplied Hourly cost/consultant Billed % Gross Margin Gross Margin Percent Contract 24.000 56 1,344,000 1,036,800 28.800 ACTUAL Solutions 15.000 128 1,920,000 992,250 22.050 Total 39.000 84 3,264,000 2,029,050 50,850 Contract 20.160 54 1,088,640 756,000 25,200 BUDGET Solutions 15.750 136 2,143,260 992,250 22,050 90 3,231,900 1,748,250 47.250 Contract F/U Solutions F/U Total Favorable/Unfavorable Decomposition Pure billing rate price variance Mix variance Revenue rate variance Pure consultant cost price variance Mix variance Consultant expense rate variance
Step by Step Solution
There are 3 Steps involved in it

Get step-by-step solutions from verified subject matter experts