

Question: FIN 330 Homework 4 For this problem use data contained in the Excel file Paired. The data were actually collected in pairs, and each row
FIN 330
Homework 4
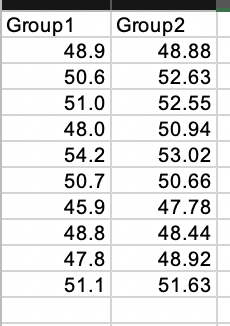
- For this problem use data contained in the Excel file Paired. The data were actually collected in pairs, and each row represents a pair.
- Suppose that we ignore the fact that the data were collected in pairs and mistakenly treat this as a two-sample problem. Perform a t-test (for two samples assuming unequal variances). [ DataAnalysis t-test: two sample assuming unequal variances] . Include print out of the tests output.
- From the test output find the two-sample t-statistic, degrees of freedom, and P-value for the two-sided alternative.
- State null hypothesis that is being tested. Would you reject the null hypothesis at 5% significance level? At 10% significance level?
- Now analyze the data in the proper way. Construct sample of the differences. Perform a one sample t-test [ You will need to create a dummy sample; make all observations in the dummy sample equal to zero; size of the dummy sample may be different from the size of your sample of diffrences. Next use t-test: two sample assuming unequal variances]. Include print out of the tests output.
- From the test output find the two-sample t-statistic, degrees of freedom, and P-value for the two-sided alternative.
- State null hypothesis that is being tested. Would you reject the null hypothesis at 5% significance level? At 10% significance level?
- Describe the differences in the two test results.
- Refer to the previous exercise. Perhaps an easier way to see the major difference in the two analysis approaches for these data is by computing 95% confidence intervals for the mean difference.
- Compute the 95% confidence interval using the two-sample t confidence interval.
- Compute the 95% confidence interval using the matched pairs t confidence interval.
- Compare the estimates (that is, the centers of the intervals) and margins of error. What is the major difference between the two approaches for these data?
- A stockbroker determines the short-run direction of the market using the average quarterly return of stock mutual funds. He believes the next quarter will be profitable when the average is greater than 1%. He will get complete quarterly return information soon, but right now he has data from a random sample of 30 stock funds. The mean quarterly return in the sample is 1.5%, and the standard deviation is 1.9%. Based on this sample, test to see if the broker will feel the next quarter will be profitable.
- State appropriate null and alternative hypotheses. Explain how you decided between the one- and two-sided alternatives.
- Find the t statistic, degrees of freedom, and P-value. State your conclusion using the =0.05 significance level.
Group1 Group2 48.88 52.63 52.55 50.94 48.9 50.6 51.0 48.0 54.2 53.02 50.7 45.9 48.8 48.44 47.848.92 51.1 50.66 47.78 51.63
Step by Step Solution
There are 3 Steps involved in it
1 Expert Approved Answer
Step: 1 Unlock

Question Has Been Solved by an Expert!
Get step-by-step solutions from verified subject matter experts
Step: 2 Unlock
Step: 3 Unlock