

Question: FINA304: Corporate Finance Assignment 1: Financial Statement Analysis Instructions: Based on the provided financial statements, calculate the following ratios and interpret the results. Interpretation and
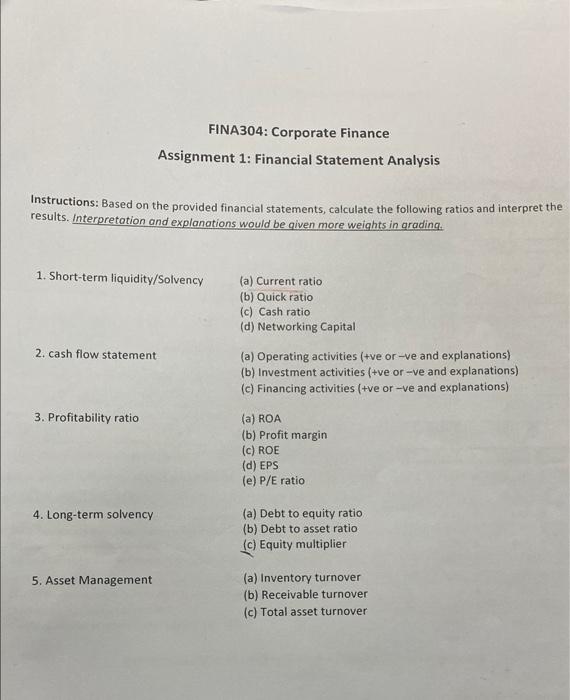
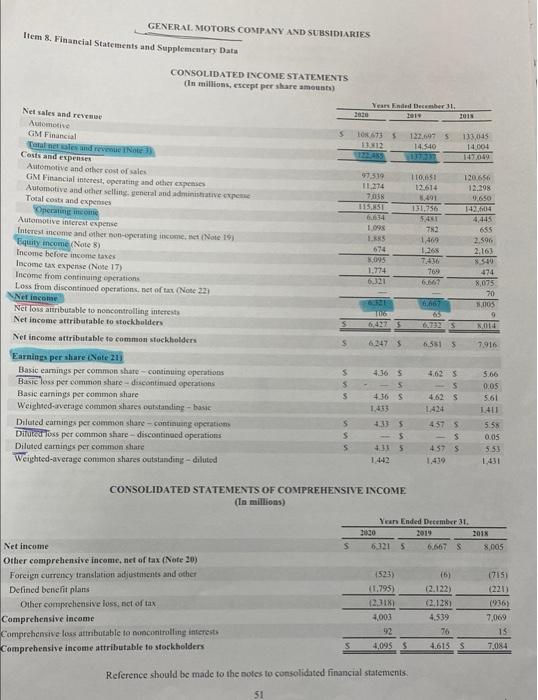
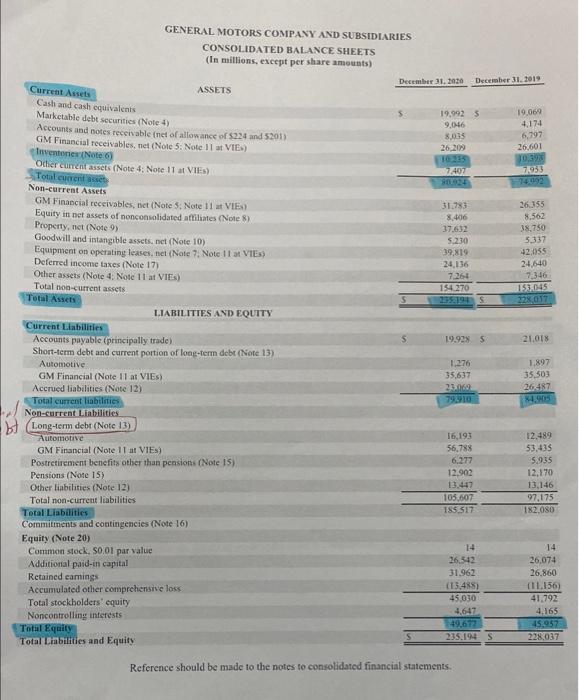
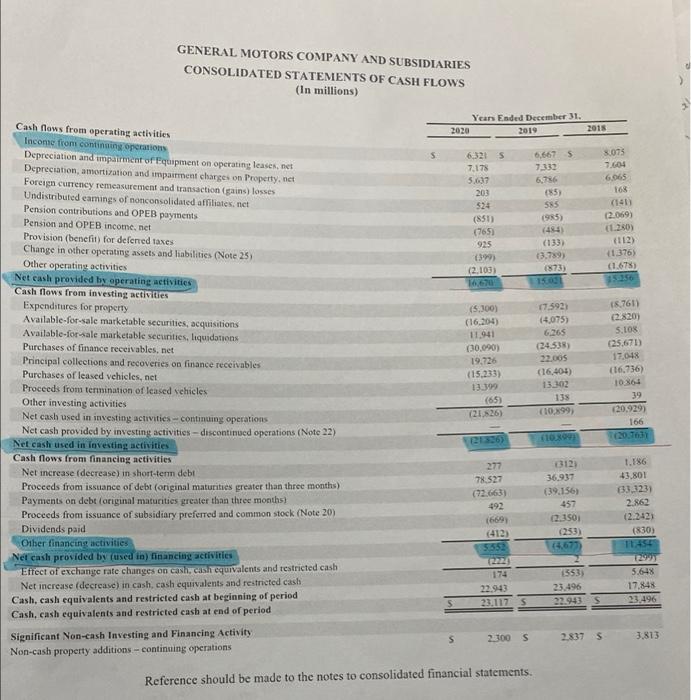
FINA304: Corporate Finance Assignment 1: Financial Statement Analysis Instructions: Based on the provided financial statements, calculate the following ratios and interpret the results. Interpretation and explanations would be given more weights in grading. 1. Short-term liquidity/Solvency (a) Current ratio (b) Quick ratio (c) Cash ratio (d) Networking Capital 2. cash flow statement (a) Operating activities (+ve or-ve and explanations) (b) Investment activities (+ve or-ve and explanations) (c) Financing activities (+ve or -ve and explanations) 3. Profitability ratio (a) ROA (b) Profit margin (c) ROE (d) EPS le) P/E ratio 4. Long-term solvency (a) Debt to equity ratio (b) Debt to asset ratio (c) Equity multiplier 5. Asset Management (a) Inventory turnover (b) Receivable turnover (c) Total asset turnover GENERAL MOTORS COMPANY AND SUBSIDIARIES Item 8. Financial Statements and Supplementary Datu CONSOLIDATED INCOME STATEMENTS In millions, except per share amounts) Versinded December 31. 200 2019 2013 LO73 12 122.647 $ 14.540 133,045 14.004 147,049 0:51 2614 3.491 151756 5:41 7.519 11.274 7. 115 ST 6614 1.098 1.RS 674 3,095 1.774 6,321 Net sales and rev Automotive GM Financial Tande Costs and expenses Automotive and other cost of sales GM Financial interest, operating and other op Automotive and other selling general and deeper Total cost and expenses Operating income Automotive interested Interest income and other non-operating incomendNote 19 Equity income (Note 3) Income before income taxes Income tax expense (Note 17) Income from continuing operations Loss from discontinued operations, net of tax (Note 223 Net Income Net lous attributable to no controlling interests Net Income attributable to stockholders Net income attributable to common stockholders Earnings per share Note 21) Basic eamings per common share - continuing operations Beste less per common share-discontinued operations Basic earnings per common share Weighted average common shares outstanding - basic Diluted camnings per common share continuing operation Diluted loss per common share-discontinued operations Diluted earnings per common share Weighted average common shares outstanding-diluted 1,469 1.265 7,436 769 6667 120656 12.298 0,650 14.04 4445 655 2.596 2,163 8340 474 8,075 70 1,005 1667 6,427 NO144 S 6.2475 6.5515 7.916 $ 5 5 4.365 5 4.36 S 1.433 4.62 S 4.625 5.66 0.05 5.61 1.411 5 S s 4335 5 4315 4375 s 4575 5.58 0.05 5.53 1,431 CONSOLIDATED STATEMENTS OF COMPREHENSIVE INCOME (la millions) Year Ended December 31 2013 61215 6.667 S 8.005 s Net income Other comprehensive income, net of tax (Note 20) Foreign currency translation adjustments and other Defined benefit plans Other comprehensive loss, net of tax Comprehensive Income Comprehensive loss attributable to non controlling interest Comprehensive income attributable to stockholders 1523) (1.795) 1231 +003 92 4,099 $ 16) (2.122) 2:128) 4,539 76 17151 (221) (936) 7,069 15 7.084 S 4,613 Reference should be made to the notes to consolidated financial statements, 51 GENERAL MOTORS COMPANY AND SUBSIDIARIES CONSOLIDATED BALANCE SHEETS (In millions, except per share amounts) December 31, 2030 December 31, 2019 Current Assets ASSETS Cash and cash oquivalents Marketable debt securities (Note 4) 19.9925 19,064 Accounts and notes receivable (net of allowance of S234 and 5201) 9,046 4.174 GM Financial receivables, met (Note 5 Note 11 VIE.) 8,035 6,797 26,209 26.601 Note TO 39 Odier content assets (Note 4 Note 11 at VIES) 7,407 74953 Total current + 1402 Non-current Assets GM Financial receivables, net (Note 5: Note 11 VIE 31.783 26.155 Equity in net assets of nonconsolidated affiliates (Note 8) 8.406 8.562 Property, net (Note 9 37.632 38.750 Goodwill and intangible assets.net (Note 10) 5.230 5.337 Equipment on operating leases, met (Note 7. Note 11 VIEX) 39,819 42,055 Deferred income taxes (Note 17) 24.136 24,640 Other assets (Note 4 Note 11 at VIES) 7264 73.46 Total non-current assets 154 270 151.045 Total Assets 215219S 728 017 LIABILITIES AND EQUITY Current Liabilities Accounts payable (principally trade) 19.928 S 21.018 Short-term debt and current portion of long-term debt (Note 13) Automotive 1.276 1.897 GM Financial (Note 11 at VIES) 35.637 35,503 Accrued liabilities (Note 12) 2006 26 487 Total current liabilities 24.905 Non-current Liabilities b Long-term debt (Note 13) Automotive 16,193 12.489 GM Financial (Note 11 at VIES) 56.788 53.435 Postretirement benefits other than pensions (Note 15) 6,277 5.935 Pensions (Note 15) 12.902 12,170 Other liabilities (Note 12) 13.447 13,146 Total non-current liabilities 105,607 97,175 Total Liabilities 185.517 182.080 Commitments and contingencies (Note 16) Equity (Note 20) Common stock. So 01 par value 14 14 Additional paid-in capital 26.542 26,074 Retained camnings 31.962 26,860 Accumulated other comprehensive loss (13.45 (11.156) Total stockholders' equity 45030 41.792 Noncontrolling interests 4.647 4.165 Total Equity 45.957 Total Liabilities and Equity 235.194 S 228,037 Reference should be made to the notes to consolidated financial statements. GENERAL MOTORS COMPANY AND SUBSIDIARIES CONSOLIDATED STATEMENTS OF CASH FLOWS (in millions) Year Ended December 31 2020 2019 2015 $ 6.321 S 7.178 5.637 201 524 (851) (765) 925 6399 (2,103) 16,670 6,667 7.332 6736 (85) 55 1985) (48 8.075 7.604 6.065 168 (141) (2.069) 1.280) (112) 1.376 (1.678) 3.789) 1873) Cash flows from operating activities Income from continuing operations Depreciation and impairment of Equipment on operating leases.net Depreciation, amortization and impairment charges on Property, net Foreign currency remeasurement and transaction (gains) losses Undistributed eamings of nonconsolidated affiliates.net Pension contributions and OPEB payments Pension and OPEB income, net Provision (benefit for deferred taxes Change in other operating assets and liabilities (Note 25) Other operating activities Net cash provided by operating activities Cash flows from investing activities Expenditures for property Available for sale marketable securities, acquisitions Available for sale marketable securities, liquidations Purchases of finance receivables, net Principal collections and recoveries on finance receivables Purchases of leased vehicles, net Proceeds from termination of leased vehicles Other investing activities Net cash used in investing activities -- continuing operations Net cash provided by investing activities - discontinued operations (Note 22) Net cash used in investing activities Cash flows from financing activities Net increase (decrease) in short-term debt Proceeds from issuance of debt (original maturities greater than three months) Payments on debt (original maturities greater than three months) Proceeds from issuance of subsidiary preferred and common stock (Note 20) Dividends paid Oiber financing activities Net cash provided by (used in) Tinancing activities Effect of exchange rate changes on cash, cash equivalents and restricted cash Net increase (decrease) in cash, cash equivalents and restricted cash Cash, cash equivalents and restricted cash at beginning of period Cash, cash equivalents and restricted cash at end of period (5.300) (16.2014) 11.941 (30.090) 19,726 (15.233) 13399 (65) (21526) 17.592) (4,075) 6.265 (24.538) 22.005 (16.404) 13302 135 (10.899) 16.761) (2.820) 5.10 (25.671) 17.0418 (16.736) 10 864 39 120.929) 166 (20. To 203363 312) 36.937 (39.156) 1.186 43.801 277 78.527 (72.663) 492 (669 (412) 5155 63.323) 2.862 (2.242) (830) (2.150i (253) 6,677 174 22.943 23.117 S 1553) 23.496 22.943 1299 5.648 17.848 23,496 S 22100 2.837 3.813 Significant Non-cash Investing and Financing Activity Non-cash property additions - continuing operations Reference should be made to the notes to consolidated financial statements. FINA304: Corporate Finance Assignment 1: Financial Statement Analysis Instructions: Based on the provided financial statements, calculate the following ratios and interpret the results. Interpretation and explanations would be given more weights in grading. 1. Short-term liquidity/Solvency (a) Current ratio (b) Quick ratio (c) Cash ratio (d) Networking Capital 2. cash flow statement (a) Operating activities (+ve or-ve and explanations) (b) Investment activities (+ve or-ve and explanations) (c) Financing activities (+ve or -ve and explanations) 3. Profitability ratio (a) ROA (b) Profit margin (c) ROE (d) EPS le) P/E ratio 4. Long-term solvency (a) Debt to equity ratio (b) Debt to asset ratio (c) Equity multiplier 5. Asset Management (a) Inventory turnover (b) Receivable turnover (c) Total asset turnover GENERAL MOTORS COMPANY AND SUBSIDIARIES Item 8. Financial Statements and Supplementary Datu CONSOLIDATED INCOME STATEMENTS In millions, except per share amounts) Versinded December 31. 200 2019 2013 LO73 12 122.647 $ 14.540 133,045 14.004 147,049 0:51 2614 3.491 151756 5:41 7.519 11.274 7. 115 ST 6614 1.098 1.RS 674 3,095 1.774 6,321 Net sales and rev Automotive GM Financial Tande Costs and expenses Automotive and other cost of sales GM Financial interest, operating and other op Automotive and other selling general and deeper Total cost and expenses Operating income Automotive interested Interest income and other non-operating incomendNote 19 Equity income (Note 3) Income before income taxes Income tax expense (Note 17) Income from continuing operations Loss from discontinued operations, net of tax (Note 223 Net Income Net lous attributable to no controlling interests Net Income attributable to stockholders Net income attributable to common stockholders Earnings per share Note 21) Basic eamings per common share - continuing operations Beste less per common share-discontinued operations Basic earnings per common share Weighted average common shares outstanding - basic Diluted camnings per common share continuing operation Diluted loss per common share-discontinued operations Diluted earnings per common share Weighted average common shares outstanding-diluted 1,469 1.265 7,436 769 6667 120656 12.298 0,650 14.04 4445 655 2.596 2,163 8340 474 8,075 70 1,005 1667 6,427 NO144 S 6.2475 6.5515 7.916 $ 5 5 4.365 5 4.36 S 1.433 4.62 S 4.625 5.66 0.05 5.61 1.411 5 S s 4335 5 4315 4375 s 4575 5.58 0.05 5.53 1,431 CONSOLIDATED STATEMENTS OF COMPREHENSIVE INCOME (la millions) Year Ended December 31 2013 61215 6.667 S 8.005 s Net income Other comprehensive income, net of tax (Note 20) Foreign currency translation adjustments and other Defined benefit plans Other comprehensive loss, net of tax Comprehensive Income Comprehensive loss attributable to non controlling interest Comprehensive income attributable to stockholders 1523) (1.795) 1231 +003 92 4,099 $ 16) (2.122) 2:128) 4,539 76 17151 (221) (936) 7,069 15 7.084 S 4,613 Reference should be made to the notes to consolidated financial statements, 51 GENERAL MOTORS COMPANY AND SUBSIDIARIES CONSOLIDATED BALANCE SHEETS (In millions, except per share amounts) December 31, 2030 December 31, 2019 Current Assets ASSETS Cash and cash oquivalents Marketable debt securities (Note 4) 19.9925 19,064 Accounts and notes receivable (net of allowance of S234 and 5201) 9,046 4.174 GM Financial receivables, met (Note 5 Note 11 VIE.) 8,035 6,797 26,209 26.601 Note TO 39 Odier content assets (Note 4 Note 11 at VIES) 7,407 74953 Total current + 1402 Non-current Assets GM Financial receivables, net (Note 5: Note 11 VIE 31.783 26.155 Equity in net assets of nonconsolidated affiliates (Note 8) 8.406 8.562 Property, net (Note 9 37.632 38.750 Goodwill and intangible assets.net (Note 10) 5.230 5.337 Equipment on operating leases, met (Note 7. Note 11 VIEX) 39,819 42,055 Deferred income taxes (Note 17) 24.136 24,640 Other assets (Note 4 Note 11 at VIES) 7264 73.46 Total non-current assets 154 270 151.045 Total Assets 215219S 728 017 LIABILITIES AND EQUITY Current Liabilities Accounts payable (principally trade) 19.928 S 21.018 Short-term debt and current portion of long-term debt (Note 13) Automotive 1.276 1.897 GM Financial (Note 11 at VIES) 35.637 35,503 Accrued liabilities (Note 12) 2006 26 487 Total current liabilities 24.905 Non-current Liabilities b Long-term debt (Note 13) Automotive 16,193 12.489 GM Financial (Note 11 at VIES) 56.788 53.435 Postretirement benefits other than pensions (Note 15) 6,277 5.935 Pensions (Note 15) 12.902 12,170 Other liabilities (Note 12) 13.447 13,146 Total non-current liabilities 105,607 97,175 Total Liabilities 185.517 182.080 Commitments and contingencies (Note 16) Equity (Note 20) Common stock. So 01 par value 14 14 Additional paid-in capital 26.542 26,074 Retained camnings 31.962 26,860 Accumulated other comprehensive loss (13.45 (11.156) Total stockholders' equity 45030 41.792 Noncontrolling interests 4.647 4.165 Total Equity 45.957 Total Liabilities and Equity 235.194 S 228,037 Reference should be made to the notes to consolidated financial statements. GENERAL MOTORS COMPANY AND SUBSIDIARIES CONSOLIDATED STATEMENTS OF CASH FLOWS (in millions) Year Ended December 31 2020 2019 2015 $ 6.321 S 7.178 5.637 201 524 (851) (765) 925 6399 (2,103) 16,670 6,667 7.332 6736 (85) 55 1985) (48 8.075 7.604 6.065 168 (141) (2.069) 1.280) (112) 1.376 (1.678) 3.789) 1873) Cash flows from operating activities Income from continuing operations Depreciation and impairment of Equipment on operating leases.net Depreciation, amortization and impairment charges on Property, net Foreign currency remeasurement and transaction (gains) losses Undistributed eamings of nonconsolidated affiliates.net Pension contributions and OPEB payments Pension and OPEB income, net Provision (benefit for deferred taxes Change in other operating assets and liabilities (Note 25) Other operating activities Net cash provided by operating activities Cash flows from investing activities Expenditures for property Available for sale marketable securities, acquisitions Available for sale marketable securities, liquidations Purchases of finance receivables, net Principal collections and recoveries on finance receivables Purchases of leased vehicles, net Proceeds from termination of leased vehicles Other investing activities Net cash used in investing activities -- continuing operations Net cash provided by investing activities - discontinued operations (Note 22) Net cash used in investing activities Cash flows from financing activities Net increase (decrease) in short-term debt Proceeds from issuance of debt (original maturities greater than three months) Payments on debt (original maturities greater than three months) Proceeds from issuance of subsidiary preferred and common stock (Note 20) Dividends paid Oiber financing activities Net cash provided by (used in) Tinancing activities Effect of exchange rate changes on cash, cash equivalents and restricted cash Net increase (decrease) in cash, cash equivalents and restricted cash Cash, cash equivalents and restricted cash at beginning of period Cash, cash equivalents and restricted cash at end of period (5.300) (16.2014) 11.941 (30.090) 19,726 (15.233) 13399 (65) (21526) 17.592) (4,075) 6.265 (24.538) 22.005 (16.404) 13302 135 (10.899) 16.761) (2.820) 5.10 (25.671) 17.0418 (16.736) 10 864 39 120.929) 166 (20. To 203363 312) 36.937 (39.156) 1.186 43.801 277 78.527 (72.663) 492 (669 (412) 5155 63.323) 2.862 (2.242) (830) (2.150i (253) 6,677 174 22.943 23.117 S 1553) 23.496 22.943 1299 5.648 17.848 23,496 S 22100 2.837 3.813 Significant Non-cash Investing and Financing Activity Non-cash property additions - continuing operations Reference should be made to the notes to consolidated financial statements
Step by Step Solution
There are 3 Steps involved in it

Get step-by-step solutions from verified subject matter experts