

Question: Find the equation of the regression line for the given data. Then construct a scatter plot of the data and draw the regression line.
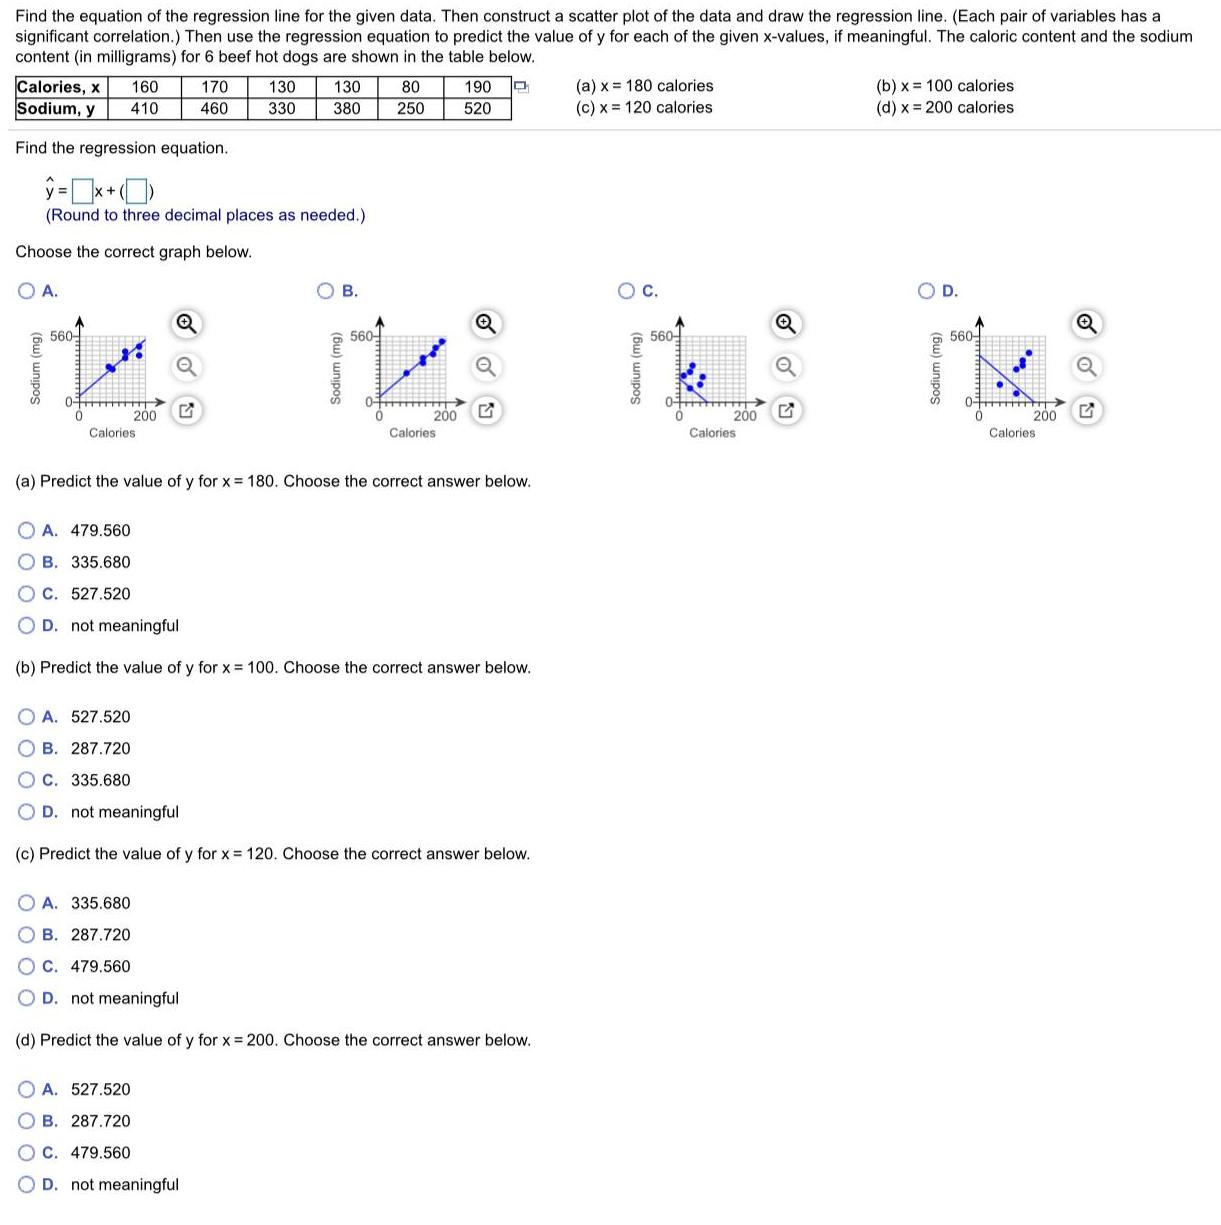
Find the equation of the regression line for the given data. Then construct a scatter plot of the data and draw the regression line. (Each pair of variables has a significant correlation.) Then use the regression equation to predict the value of y for each of the given x-values, if meaningful. The caloric content and the sodium content (in milligrams) for 6 beef hot dogs are shown in the table below. Calories, x Sodium, y (a) x = 180 calories (c) x = 120 calories (b) x = 100 calories (d) x = 200 calories 160 170 130 130 80 190 410 460 330 380 250 520 Find the regression equation. (Round to three decimal places as needed.) Choose the correct graph below. O A. . OC. OD. 560- 560- 560- 560- 0- 200 200 200 200 Calories Calories Calories Calories (a) Predict the value of y for x = 180. Choose the correct answer below. O A. 479.560 B. 335.680 O C. 527.520 O D. not meaningful (b) Predict the value of y for x = 100. Choose the correct answer below. A. 527.520 B. 287.720 C. 335.680 D. not meaningful (c) Predict the value of y for x = 120. Choose the correct answer below. O A. 335.680 B. 287.720 C. 479.560 O D. not meaningful (d) Predict the value of y for x 200. Choose the correct answer below. O A. 527.520 B. 287.720 C. 479.560 O D. not meaningful (m) unipos (Bu) wnipos (Bu) wnipos (Bu) wnipos
Step by Step Solution
3.55 Rating (159 Votes )
There are 3 Steps involved in it
Our experts were unable to provide an ans... View full answer

Get step-by-step solutions from verified subject matter experts