Question: Finance case study: What are the challenges facing Monsanto? (based on the screenshots). I also put the description for the case below the screenshots if
Finance case study:
What are the challenges facing Monsanto? (based on the screenshots).
I also put the description for the case below the screenshots if that is helpful.
Thanks!
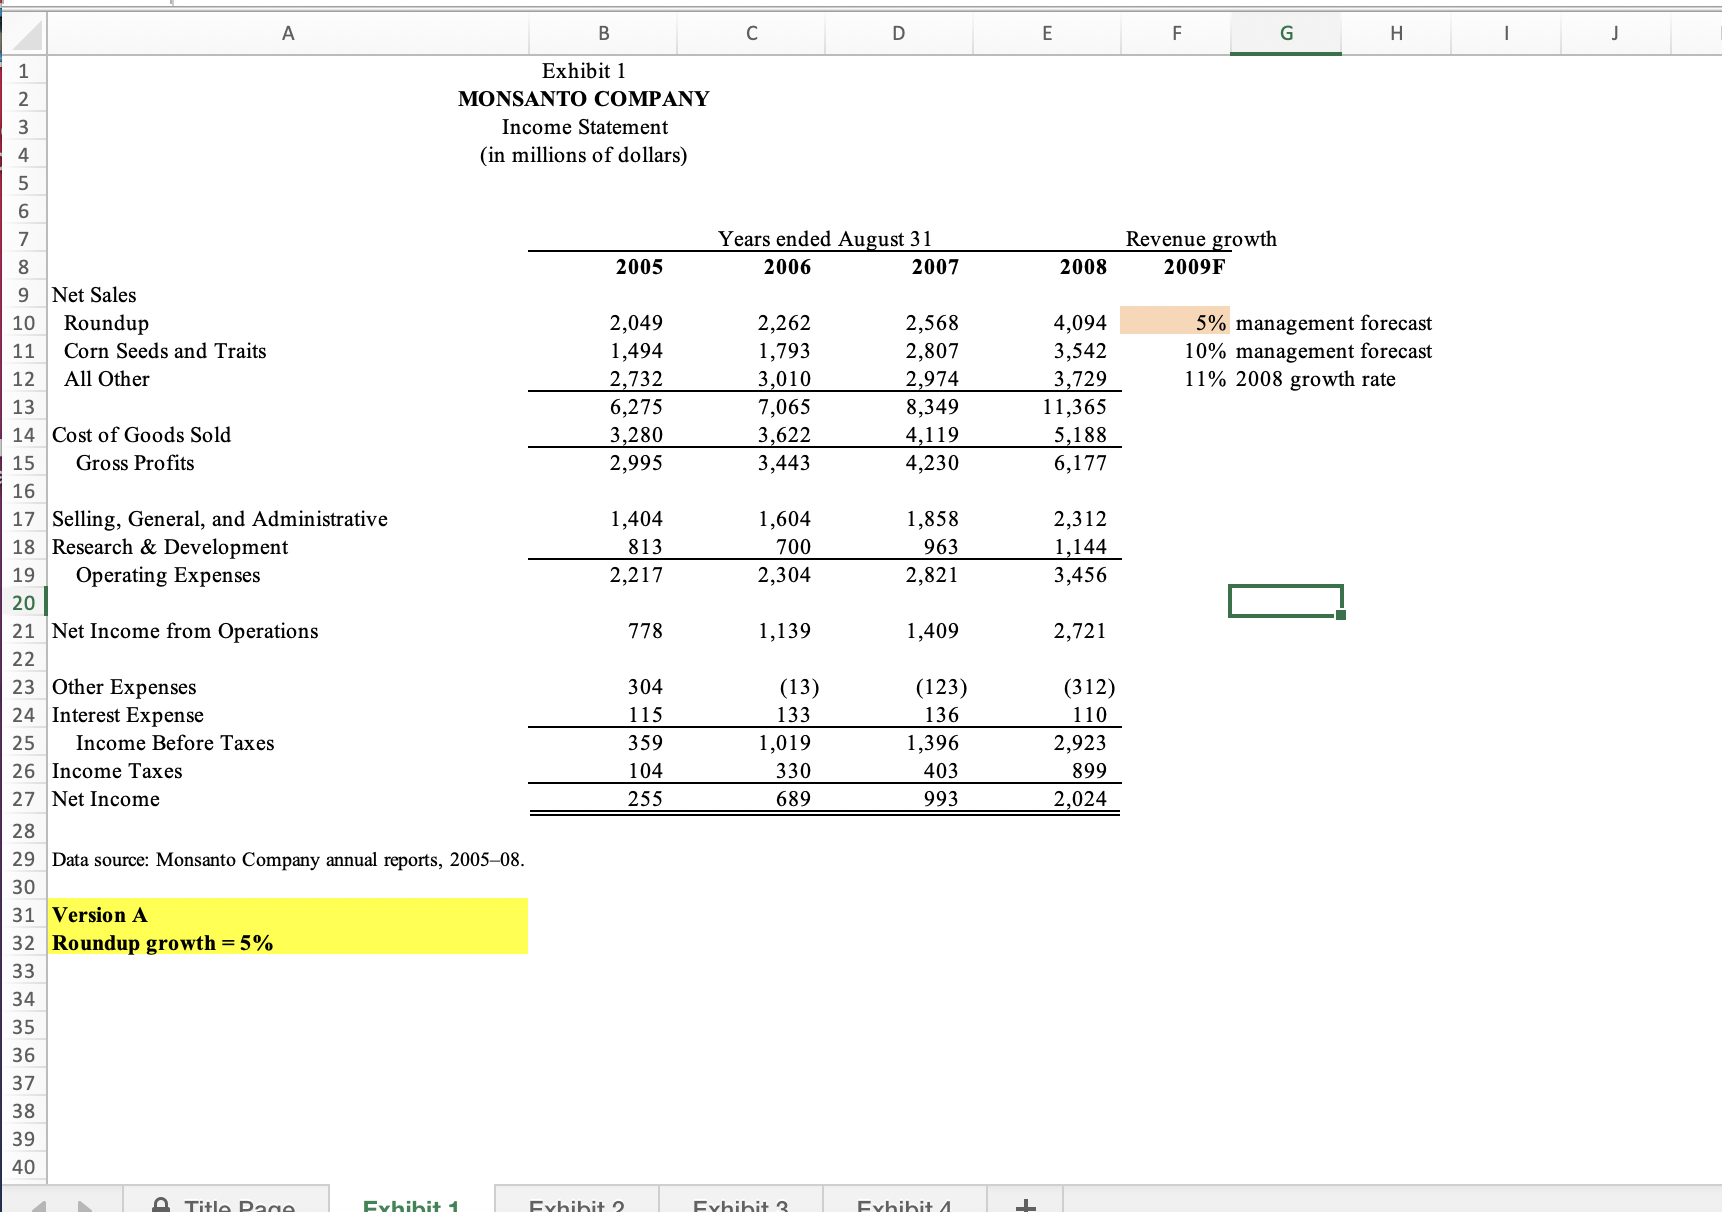
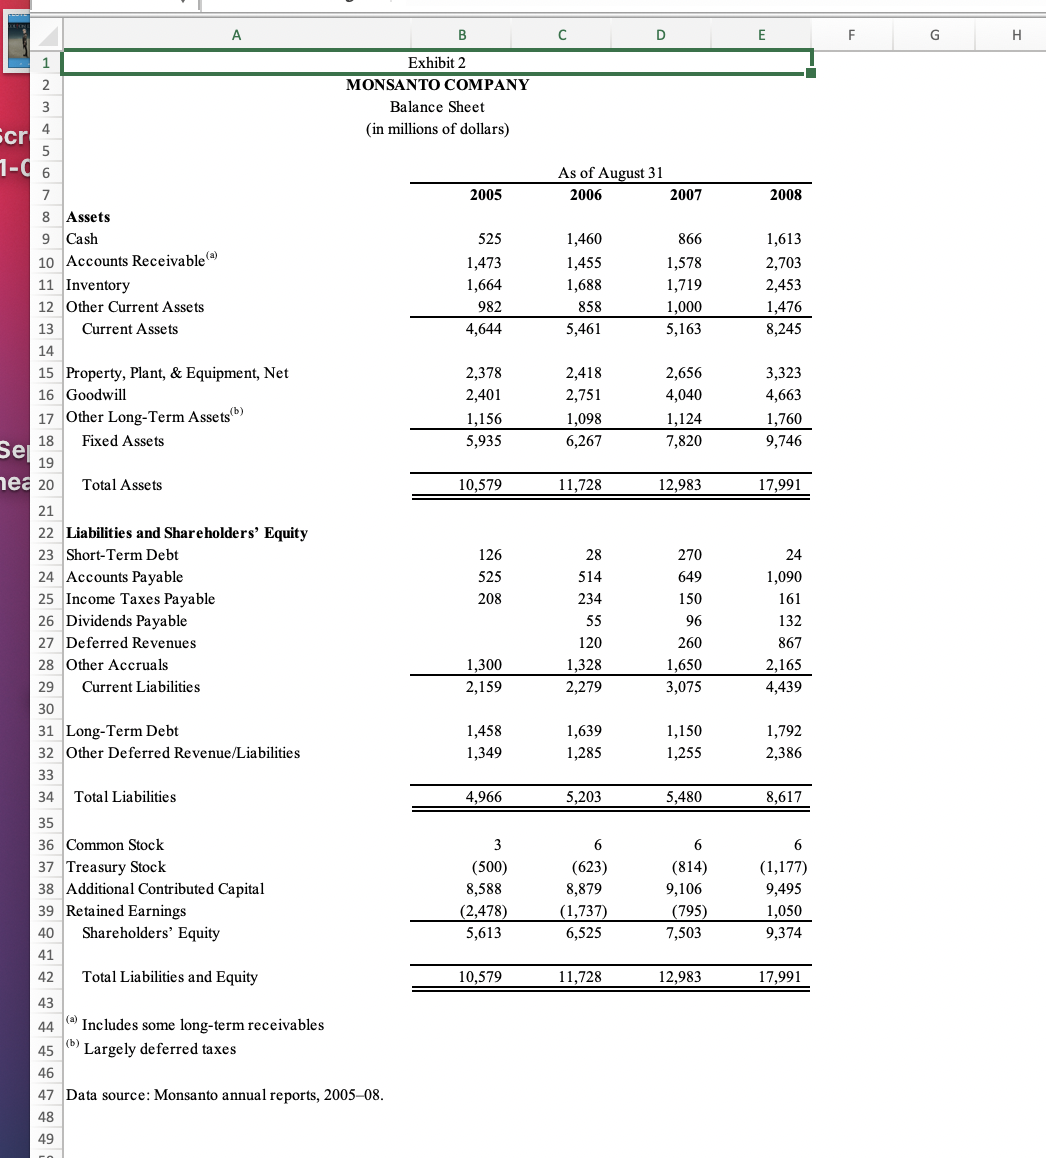
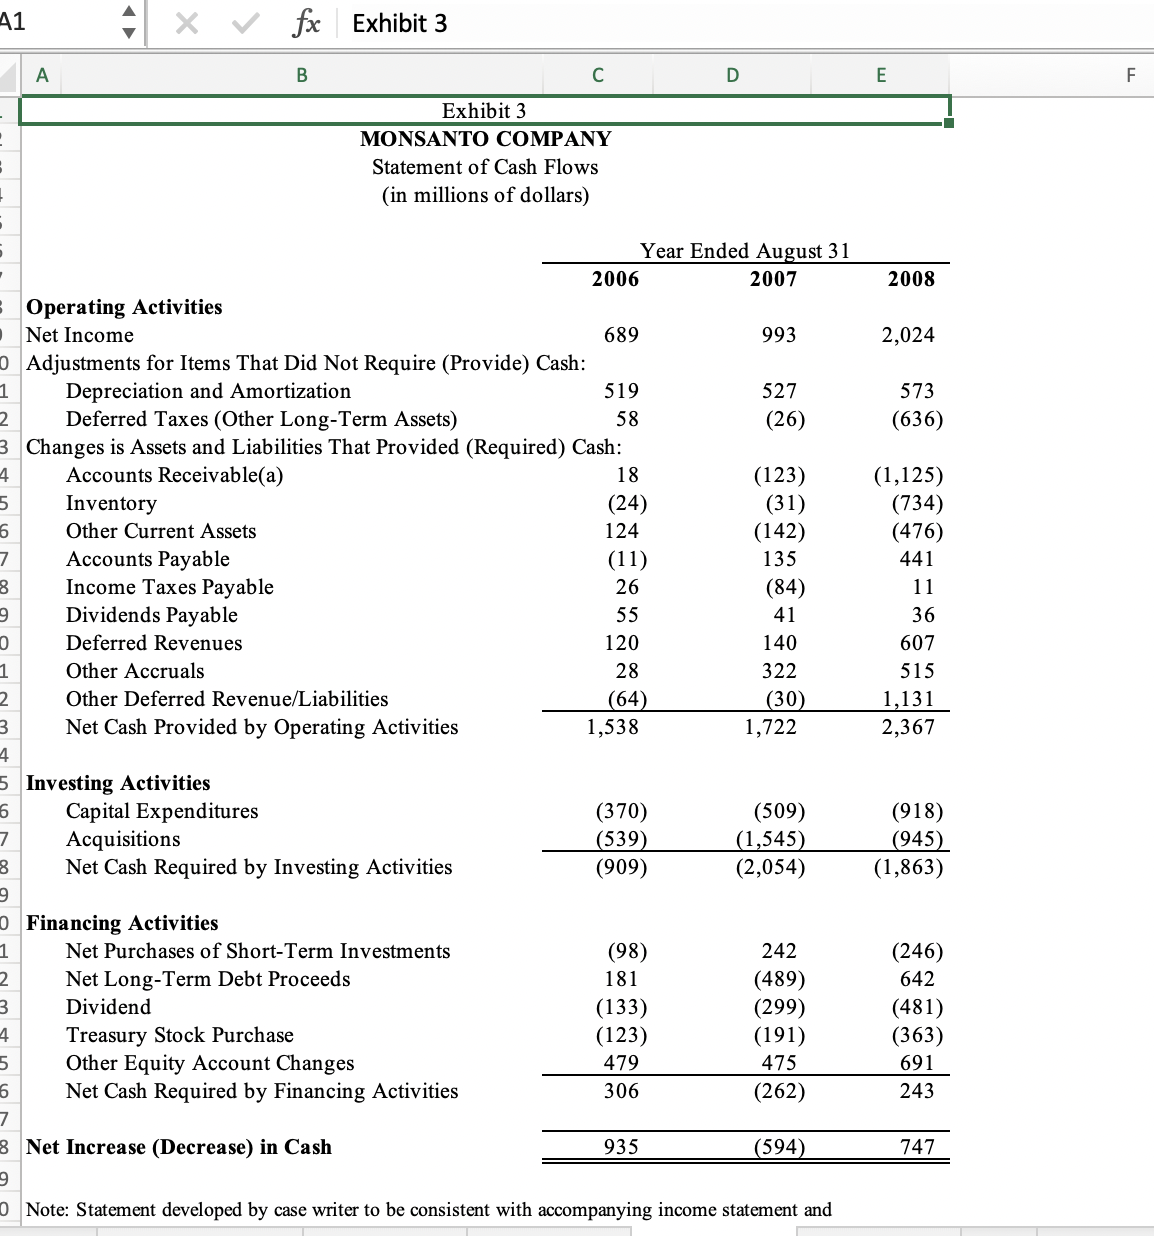
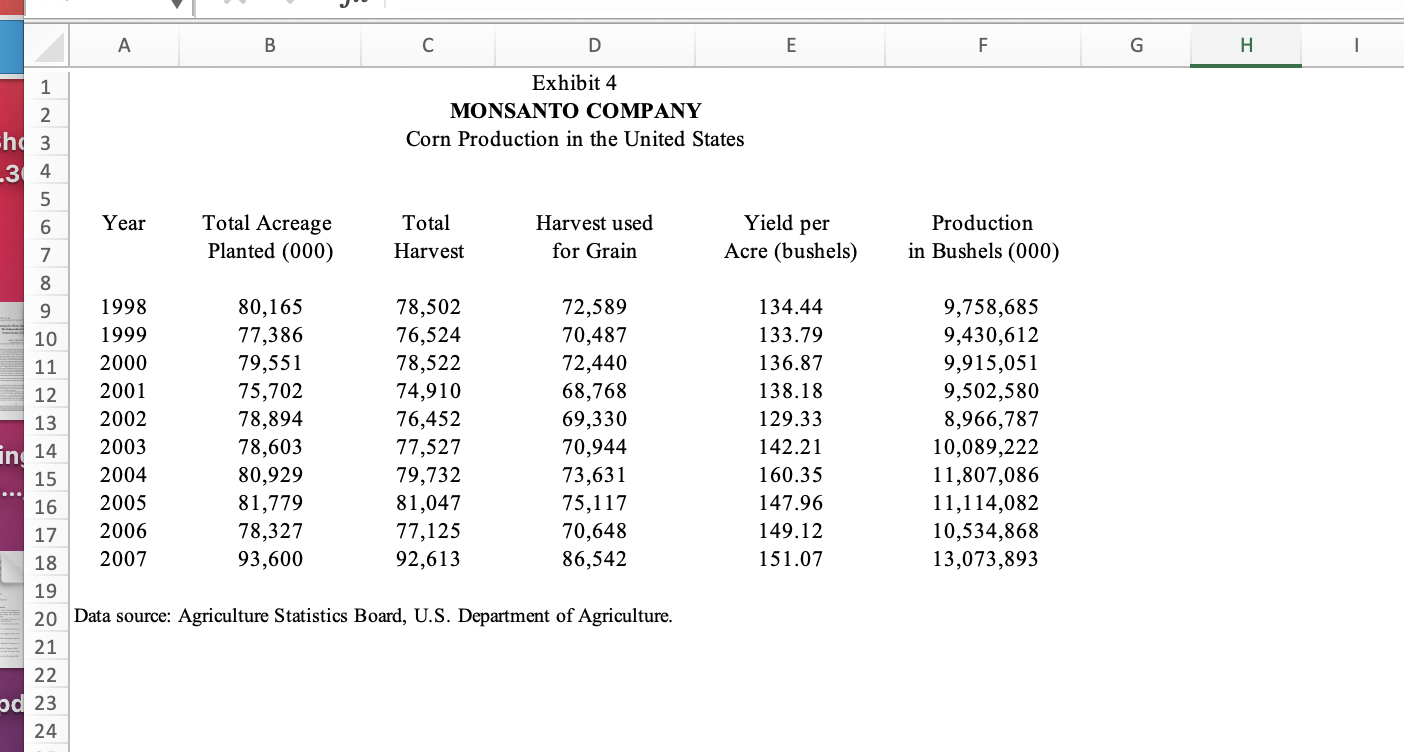
A B C D E F G H Exhibit 1 MONSANTO COMPANY Income Statement (in millions of dollars) Years ended August 31 Revenue growth 2005 2006 2007 2008 2009F Net Sales 10 Roundup 2,049 2,262 2,568 4,094 5% management forecast 11 Corn Seeds and Traits 1,494 1,793 2,807 3,542 10% management forecast 12 All Other 2, 732 3.010 2,974 3,729 11% 2008 growth rate 13 6,275 7,065 8,349 1,365 14 Cost of Goods Sold 3,280 3,622 4,119 5,188 15 Gross Profits 2,995 3,443 4,230 5,177 16 17 Selling, General, and Administrative 1,404 1,604 1,858 2,312 18 Research & Development 813 700 963 1,144 19 Operating Expenses 2,217 2,304 2,821 3,456 20 21 Net Income from Operations 778 1,139 1,409 2,721 22 23 Other Expenses 304 (13) (123) (312) 24 Interest Expense 115 133 36 110 25 Income Before Taxes 359 1,019 1,396 2,923 26 Income Taxes 104 330 403 899 t Income 255 689 993 2,024 28 29 Data source: Monsanto Company annual reports, 2005-08. 30 31 Version A 32 Roundup growth = 5% 33 34 35 36 37 38 39 401 I _ - A B C D E 1 Exhibit 2 2 MONSANTO COMPANY 3 Balance Sheet C 1' 4 (in millions of dollars) 5 ( 6 As ofAuElgtSI T 2005 2006 200'?r 2008 8 Assets 9 Cash 525 1,460 866 1,613 13 Accounts Receivable'\" 1,473 1,455 1,573 2,733 11 Inventory 1,664 1,633 1,719 2,453 12 Other Current Assets 982 858 1,000 1,476 13 Current Assets 4,644 5,461 5,163 3,245 14 15 Property, Plant, 3: Equipment, Net 2,373 2,413 2,656 3,323 16 Goodwill 2,431 2,751 4,343 4,663 17 Other long-Term Assets'\" 1,156 1,393 1,124 1,763 e. 13 Fixed Assets 5,935 6,267 7,323 9,746 b l. 19 ea 20 Total Assets 13,579 11,723 12,933 17,991 21 22 liabilities smlShareholders' Equity 23 Short-Term Debt 126 28 270 24 24 Accounts Payable 525 514 649 1,090 25 Income Taxes Payable 208 234 150 161 26 Dividends Payable 55 96 132 2? Deferred Revenues 120 260 86'?r 23 Other Accruals 1,333 1,323 1,653 2,165 23 Current Liabilities 2,159 2,279 3,375 4,439 30 31 Long-Term Debt 1,453 1,639 1,153 1,792 32 Other Deferred RevenueJLiabilities 1,349 1,285 1,255 2,386 33 34 Total Liabilities 4,966 5,233 5,433 3,617 35 35 Down Stock 3 6 6 6 37 Treasury Stock (533) (623) (314) (1,177) 38 Additional Contributed Capital 8,588 8,8'11'9I 9,106 9,495 33 Retained Earnings (2,473) (1,737) (795) 1,353 43 Shareholders\" Equity 5,613 6,525 7,533 9,374 41 42 Total Liabilities and Equity 13,579 1 1,723 12,933 17,991 43 44 1" Includes some long-term receivables 45 1'" Largely deferred taxes 42 Data source: Monsanto annual reports, 200503. A1 $ .. _ e Exhibit 3 A B C D E . Exhibit 3 t MONSANTO COMPANY Statement of Cash Flows (in millions of dollars) Year Ended August 31 2006 2007 2008 : Operating Activities I Net Income 689 993 2,024 0 Adjustments for Items That Did Not Require (Provide) Cash: 1 Depreciation and Amortization 519 527 573 2 Deferred Taxes (Other Long-Term Assets) 58 (2 6) (636) 3 Changes is Assets and Liabilities That Provided (Required) Cash: 4 Accounts Receivable(a) 18 (123) (1,125) 5 Inventory (24) (3 1) (734) 6 Other Current Assets 124 (142) (476) 7 Accounts Payable (1 1) 13 5 441 3 Income Taxes Payable 26 (84) 11 9 Dividends Payable 55 41 3 6 D Deferred Revenues 120 140 607 1 Other Accruals 28 322 51 5 2 Other Deferred Revenuea'Liabilities 64 30 1 131 3 Net Cash Provided by Operating Activities 1,538 1,722 2,367 4 5 Investing Activities 5 Capital Expenditures (3 70) (509) (91 8) 7 Acquisitions 539 1 545 945 8 Net Cash Required by Investing Activities (909) (2,054) (1,863) 9 0 Financing Activities 1 Net Purchases of Short-Tenn Investments (98) 242 (246) 2 Net Long-Term Debt Proceeds 181 (489) 642 3 Dividend (133) (299) (481) 4 Treasury Stock Purchase (123) (191) (363) 5 Other Equity Account Changes 479 475 691 5 Net Cash Required by Financing Activities 306 (2 62) 243 7 8 Net Increase (Decrease) in Cash 935 594 747 9 0 Note: Statement developed by case writa' to be consistmt with accompanying income statanmt and VI J" A B C D E F 1 Exhibit 4 2 MONSANTO COMPANY h, 3 Corn Production in the United States 3 4 5 5 Year Total Acreage Total Harvest used Yield per Production 7 Planted (000) Harvest for Grain Acre (bushels) in Bushels {000) 8 9 1998 80,165 78,502 72,589 134.44 9,758,685 . 10 1999 77,386 76,524 70,487 133.79 9,430,612 7:_:_ 11 2000 79,551 78,522 72,440 136.87 9,915,051 1 12 2001 75,702 74,910 68,768 138.18 9,502,580 13 2002 78,894 76,452 69,330 129.33 8,966,787 n1 14 2003 78,603 77,527 70,944 142.21 10,089,222 15 2004 80,929 79,732 73,631 160.35 11,807,086 15 2005 81,779 81,047 75,117 147.96 11,114,082 17 2006 78,327 77,125 70,648 149.12 10,534,868 13 2007 93,600 92,613 86,542 151.07 13,073,893 - 19 5 ' 20 Data source: Agriculture Statistics Board, U.S. Department ongricIture. :33 21 22 I d 23 24
Step by Step Solution
There are 3 Steps involved in it
1 Expert Approved Answer
Step: 1 Unlock
Question Has Been Solved by an Expert!
Get step-by-step solutions from verified subject matter experts
Step: 2 Unlock
Step: 3 Unlock
Students Have Also Explored These Related Finance Questions!