

Question: Finance Detective (Financial Statement Analysis, A Strategic Perspective, Clyde P. Stickney/Amos Tuck School of Business Administration, Darthmouth College) Effective financial statement analysis requires an understanding
Finance Detective (Financial Statement Analysis, A Strategic Perspective, Clyde P. Stickney/Amos Tuck School of Business Administration, Darthmouth College)
Effective financial statement analysis requires an understanding of the economic characteristics of the firm being analyzed. Many of these economic characteristics are captured in the relationship between various financial statement items. The exhibit presents condensed financial statement information for firms in 13 different industries. Balance sheet and income statements items are expressed as a percentage of total revenues (that is, all amounts are divided by total revenues for the year). The 13 companies (all corporations except the professional basketball franchise) shown represent the following industries:
1. Advertising agency 2. Aerospace manufacturer (significant government contracts) 3. Beer brewery 4. Computer manufacturer 5. Department store chain 6. Distiller of hard liquor 7. Electric utility 8. Finance company (also involved in leasing) 9. Grocery store chain 10. Life insurance company 11. Pharmaceutical company 12. Professional basketball franchise (a partnership) 13. Steel manufacture
Use whatever clues that you can to match the companies in the exhibit with the industries listed above.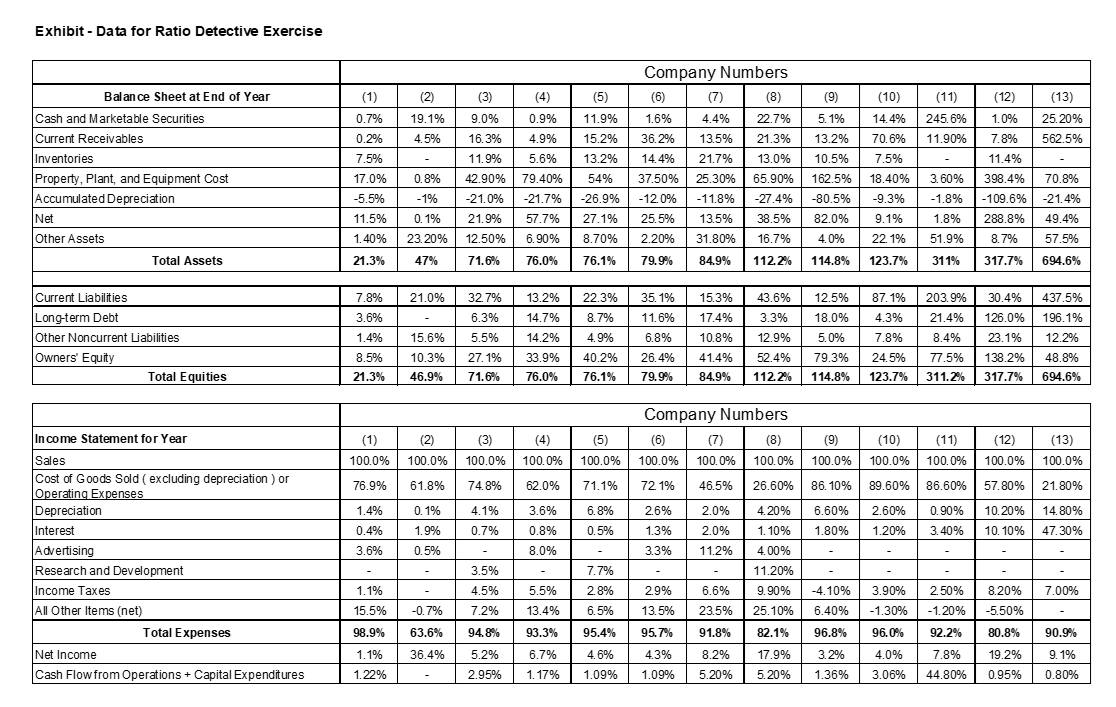
Exhibit - Data for Ratio Detective Exercise Company Numbers (6) (8) (1) (3) (5) (9) (13) (2) 19.1% 4.5% (4) 0.9% (11) 245.6% (12) 1.0% 9.0% 1.6% 4.4% 22.7% 0.7% 0.2% 5.1% 25.20% 562.5% 36.2% 13.2% Balance Sheet at End of Year Cash and Marketable Securities Current Receivables linventories Property, Plant, and Equipment Cost Accumulated Depreciation Net 11.90% 4.9% 5.6% 11.9% 15.2% 13.2% 54% 13.5% 21.7% (10) 14.4% 70.6% 7.5% 18.40% 21.3% 13.0% 7.8% 11.4% 16.3% 11.9% 42.90% -21.0% 10.5% 7.5% 17.0% -5.5% 14.4% 37.50% 0.8% 79.40% 25.30% 398.4% 70.8% 162.5% -80.5% - 1% -21.7% -26.9% -12 0% - 11.8% -109.6% 65.90% -27.4% 38.5% 16.7% 3.60% -1.8% 1.8% 51.9% 11.5% 1.40% 0.1% 23. 20% 21.9% 12.50% 57.7% 6.90% 27.1% 8.70% 25.5% 2.20% 13.5% 31.80% -9.3% 9.1% 22 1% 82.0% 4.0% 288.8% 8.7% -21.4% 49.4% 57.5% Other Assets Total Assets 21.3% 47% 71.6% 76.0% 76.1% 79.9% 84.9% 112.2% 114.8% 123.7% 311% 317.7% 694.6% 21.0% 32.7% 35.1% 87.1% 7.8% 3.6% 22.3% 8.7% 13.2% 14.7% 14.2% 12.5% 18.0% 437.5% 196.1% 6.3% 11.6% Current Liabilities Long-term Debt Other Noncurrent Liabilities Owners' Equity Total Equities 4.3% 43.6% 3.3% 12.9% 52.4% 203.9% 21.4% 8.4% 77.5% 4.9% 1.4% 8.5% 21.3% 5.0% 15.3% 17.4% 10.8% 41.4% 84.9% 15.6% 10.3% 5.5% 27.1% 6.8% 26.4% 7.8% 24.5% 30.4% 126.0% 23.1% 138.2% 317.7% 33.9% 40.2% 79.3% 12.2% 48.8% 694.6% 46.9% 71.6% 76.0% 76.1% 79.9% 112.2% 114.8% 123.7% 311.2% (1) 100.0% (2) 100.0% (3) 100.0% (4) 100.0% (5) 100.0% Company Numbers (6) (8) 100.0% 100.0% 100.0% (9) 100.0% (10) 100.0% (11) (12) (13) 100.0% 100.0% 100.0% 86.60% 57.80% 21.80% 76.9% 61.8% 74.8% 62.0% 71.1% 72.1% 46.5% 26.60% 86. 10% 89.60% 1.4% 0.1% 4.1% 6.8% 2.6% 2.0% 6.60% 0.90% 10.20% 14.80% 3.6% 0.8% 2.60% 1.20% 0.7% Income Statement for Year Sales Cost of Goods Sold (excluding depreciation) or Operating Expenses Depreciation Interest Advertising Research and Development Income Taxes All Other Items (net) Total Expenses 0.5% 1.3% 1.80% 3.40% 10.10% 47.30% 0.4% 3.6% % 1.9% 0.5% 2.0% 11.2% 4.20% 1. 10% 4.00% 11.20% 8.0% 3.3% - 3.5% . 5.5% 6.6% 7.7% 2.8% 6.5% 9.90% 3.90% 2.50% 1.1% 15.5% 7.00% 4.5% 7.2% 2.9% 13.5% -4.10% 6.40% 8.20% -5.50% -0.7% 13.4% 23.5% 25.10% -1.20% -1.30% 96.0% 98.9% 63.6% 94.8% 93.3% 95.4% 95.7% 91.8% 82.1% 96.8% 92.2% 80.8% 90.9% Net Income 36.4% 4.6% 4.3% 1.1% 1.22% 5.2% 2.95% 6.7% 1. 17% 8.2% 5.20% 17.9% 5. 20% 3.2% 1.36% 4.0% 3.06% 7.8% 44.80% 19.2% 0.95% 9.1% 0.80% Cash Flow from Operations + Capital Expenditures 1.09% 1.09% Exhibit - Data for Ratio Detective Exercise Company Numbers (6) (8) (1) (3) (5) (9) (13) (2) 19.1% 4.5% (4) 0.9% (11) 245.6% (12) 1.0% 9.0% 1.6% 4.4% 22.7% 0.7% 0.2% 5.1% 25.20% 562.5% 36.2% 13.2% Balance Sheet at End of Year Cash and Marketable Securities Current Receivables linventories Property, Plant, and Equipment Cost Accumulated Depreciation Net 11.90% 4.9% 5.6% 11.9% 15.2% 13.2% 54% 13.5% 21.7% (10) 14.4% 70.6% 7.5% 18.40% 21.3% 13.0% 7.8% 11.4% 16.3% 11.9% 42.90% -21.0% 10.5% 7.5% 17.0% -5.5% 14.4% 37.50% 0.8% 79.40% 25.30% 398.4% 70.8% 162.5% -80.5% - 1% -21.7% -26.9% -12 0% - 11.8% -109.6% 65.90% -27.4% 38.5% 16.7% 3.60% -1.8% 1.8% 51.9% 11.5% 1.40% 0.1% 23. 20% 21.9% 12.50% 57.7% 6.90% 27.1% 8.70% 25.5% 2.20% 13.5% 31.80% -9.3% 9.1% 22 1% 82.0% 4.0% 288.8% 8.7% -21.4% 49.4% 57.5% Other Assets Total Assets 21.3% 47% 71.6% 76.0% 76.1% 79.9% 84.9% 112.2% 114.8% 123.7% 311% 317.7% 694.6% 21.0% 32.7% 35.1% 87.1% 7.8% 3.6% 22.3% 8.7% 13.2% 14.7% 14.2% 12.5% 18.0% 437.5% 196.1% 6.3% 11.6% Current Liabilities Long-term Debt Other Noncurrent Liabilities Owners' Equity Total Equities 4.3% 43.6% 3.3% 12.9% 52.4% 203.9% 21.4% 8.4% 77.5% 4.9% 1.4% 8.5% 21.3% 5.0% 15.3% 17.4% 10.8% 41.4% 84.9% 15.6% 10.3% 5.5% 27.1% 6.8% 26.4% 7.8% 24.5% 30.4% 126.0% 23.1% 138.2% 317.7% 33.9% 40.2% 79.3% 12.2% 48.8% 694.6% 46.9% 71.6% 76.0% 76.1% 79.9% 112.2% 114.8% 123.7% 311.2% (1) 100.0% (2) 100.0% (3) 100.0% (4) 100.0% (5) 100.0% Company Numbers (6) (8) 100.0% 100.0% 100.0% (9) 100.0% (10) 100.0% (11) (12) (13) 100.0% 100.0% 100.0% 86.60% 57.80% 21.80% 76.9% 61.8% 74.8% 62.0% 71.1% 72.1% 46.5% 26.60% 86. 10% 89.60% 1.4% 0.1% 4.1% 6.8% 2.6% 2.0% 6.60% 0.90% 10.20% 14.80% 3.6% 0.8% 2.60% 1.20% 0.7% Income Statement for Year Sales Cost of Goods Sold (excluding depreciation) or Operating Expenses Depreciation Interest Advertising Research and Development Income Taxes All Other Items (net) Total Expenses 0.5% 1.3% 1.80% 3.40% 10.10% 47.30% 0.4% 3.6% % 1.9% 0.5% 2.0% 11.2% 4.20% 1. 10% 4.00% 11.20% 8.0% 3.3% - 3.5% . 5.5% 6.6% 7.7% 2.8% 6.5% 9.90% 3.90% 2.50% 1.1% 15.5% 7.00% 4.5% 7.2% 2.9% 13.5% -4.10% 6.40% 8.20% -5.50% -0.7% 13.4% 23.5% 25.10% -1.20% -1.30% 96.0% 98.9% 63.6% 94.8% 93.3% 95.4% 95.7% 91.8% 82.1% 96.8% 92.2% 80.8% 90.9% Net Income 36.4% 4.6% 4.3% 1.1% 1.22% 5.2% 2.95% 6.7% 1. 17% 8.2% 5.20% 17.9% 5. 20% 3.2% 1.36% 4.0% 3.06% 7.8% 44.80% 19.2% 0.95% 9.1% 0.80% Cash Flow from Operations + Capital Expenditures 1.09% 1.09%
Step by Step Solution
There are 3 Steps involved in it

Get step-by-step solutions from verified subject matter experts