

Question: Financial Accounting - Chapters 8 & 9 CLASSROOM ACTIVITY #4 - Financial Statement Analysis This is the balance sheet of the Fleetwood Company as of
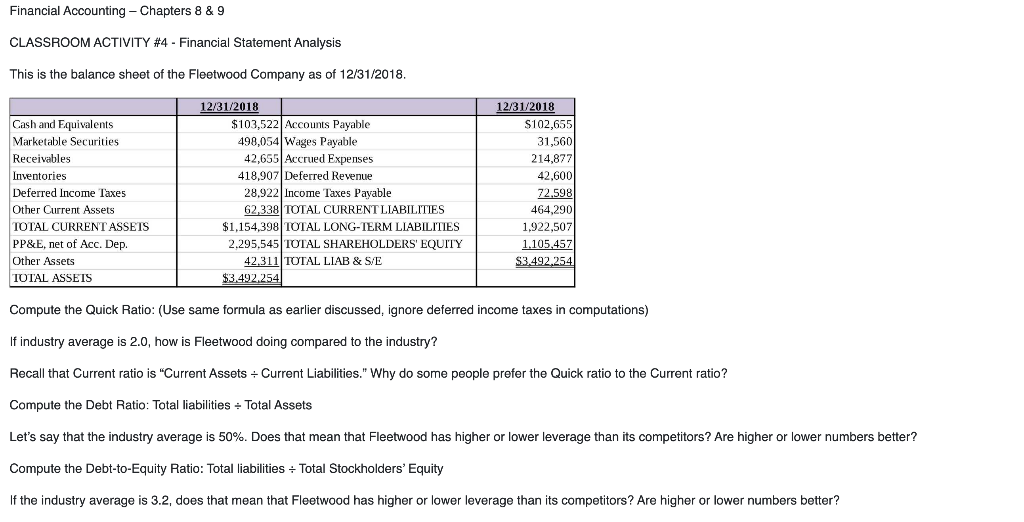
Financial Accounting - Chapters 8 & 9 CLASSROOM ACTIVITY #4 - Financial Statement Analysis This is the balance sheet of the Fleetwood Company as of 12/31/2018. Cash and Equivalents Marketable Securities Receivables Inventories Deferred Income Taxes Other Current Assets TOTAL CURRENT ASSETS PP&E, net of Acc. Dep. Other Assets TOTAL ASSETS 12/31/2018 $103,522 Accounts Payable 498,054 Wages Payable 42,655 Accrued Expenses 418,907 Deferred Revenue 28,922 Income Taxes Payable 62,338 TOTAL CURRENT LIABILITIES $1,154,398 TOTAL LONG-TERM LIABILITIES 2.295,545 TOTAL SHAREHOLDERS' EQUITY 42.311 TOTAL LIAB & S/E $3.492,254 12/31/2018 $102,655 31,560 214.877 42,600 72.598 464,290 1,922.507 1.105,457 S3,492,254 Compute the Quick Ratio: (Use same formula as earlier discussed, ignore deferred income taxes in computations) If industry average is 2.0, how is Fleetwood doing compared to the industry? Recall that Current ratio is "Current Assets - Current Liabilities." Why do some people prefer the Quick ratio to the Current ratio? Compute the Debt Ratio: Total liabilities - Total Assets Let's say that the industry average is 50%. Does that mean that Fleetwood has higher or lower leverage than its competitors? Are higher or lower numbers better? Compute the Debt-to-Equity Ratio: Total liabilities - Total Stockholders' Equity If the industry average is 3.2, does that mean that Fleetwood has higher or lower leverage than its competitors? Are higher or lower numbers better
Step by Step Solution
There are 3 Steps involved in it

Get step-by-step solutions from verified subject matter experts