

Question: Financial Accounting Financial Statement Analysis Project Instructions For this project, you will use the provided financial statements for Ford Motor Company and GM Motors. Take
Financial Accounting
Financial Statement Analysis Project
Instructions
For this project, you will use the provided financial statements for Ford Motor Company and GM Motors. Take 2019 information given and perform the required financial ratios listed below. Compare the ratios of 2019 to each of the two auto companies. In comparing the ratios you will need to discuss which company has a better ratio, justify your rationale, and explain your findings in detail in your analysis. Write at least one paragraph discussing your results for each ratio.
Part 1:
- What is the ratio used for, what is its purpose?
- Write out formula
- Fill out formula using the two years financial statement information for both companies
- Your interpretation of ratio in at least one paragraph
Part 2: For each of the four categories of ratios, identify what the four categories are, and in your own words, explain the following
- Who are the main stakeholders?
- What are they assessing?
- Why are they assessing it?
Part 1
Ford-2019 GM-2019
Profitability
- Earnings Per Share
1)
2)
3)
4)
- Return on Total Assets
1)
2)
3)
4)
- Return on Equity
1)
2)
3)
4)
- Profit Margin Ratio
1)
2)
3)
4)
- Gross Margin Ratio
1)
2)
3)
4)
Solvency/Leverage
- Debt Ratio
1)
2)
3)
4)
- Equity Ratio
1)
2)
3)
4)
- Debt to Equity Ratio
1)
2)
3)
4)
- Times Interest Earned
1)
2)
3)
4)
Liquidity and Efficiency
- Current Ratio
1)
2)
3)
4)
- Acid-Test Ratio
1)
2)
3)
4)
- Accounts Receivable Turnover
1)
2)
3)
4)
- Inventory Turnover
1)
2)
3)
4)
- Days Sales Uncollected
1)
2)
3)
4)
- Days Sales in Inventory
1)
2)
3)
4)
- Total Asset Turnover
1)
2)
3)
4)
Market Prospects
- Price-earnings Ratio
1)
2)
3)
4)
- Dividend Yield
1)
2)
3)
4)
Part 2
Category 1:
- Who are the main stakeholders?
- What are they assessing?
- Why are they assessing it?
Category 2:
- Who are the main stakeholders?
- What are they assessing?
- Why are they assessing it?
Category 3:
- Who are the main stakeholders?
- What are they assessing?
- Why are they assessing it?
Category 4:
- Who are the main stakeholders?
- What are they assessing?
- Why are they assessing it?
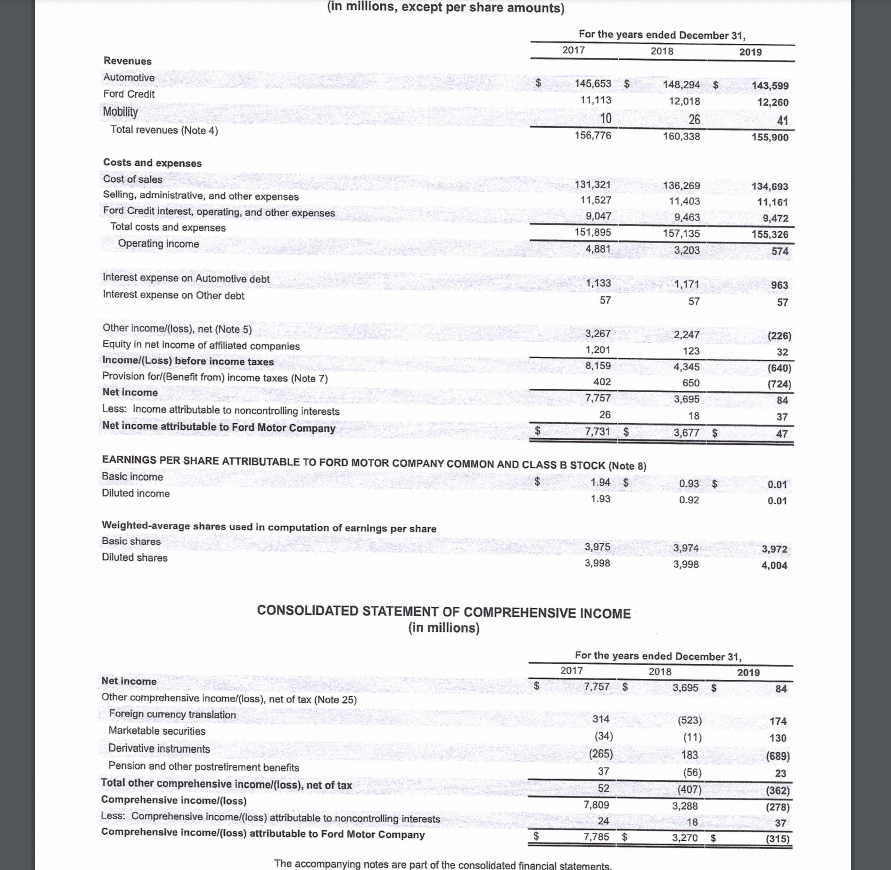
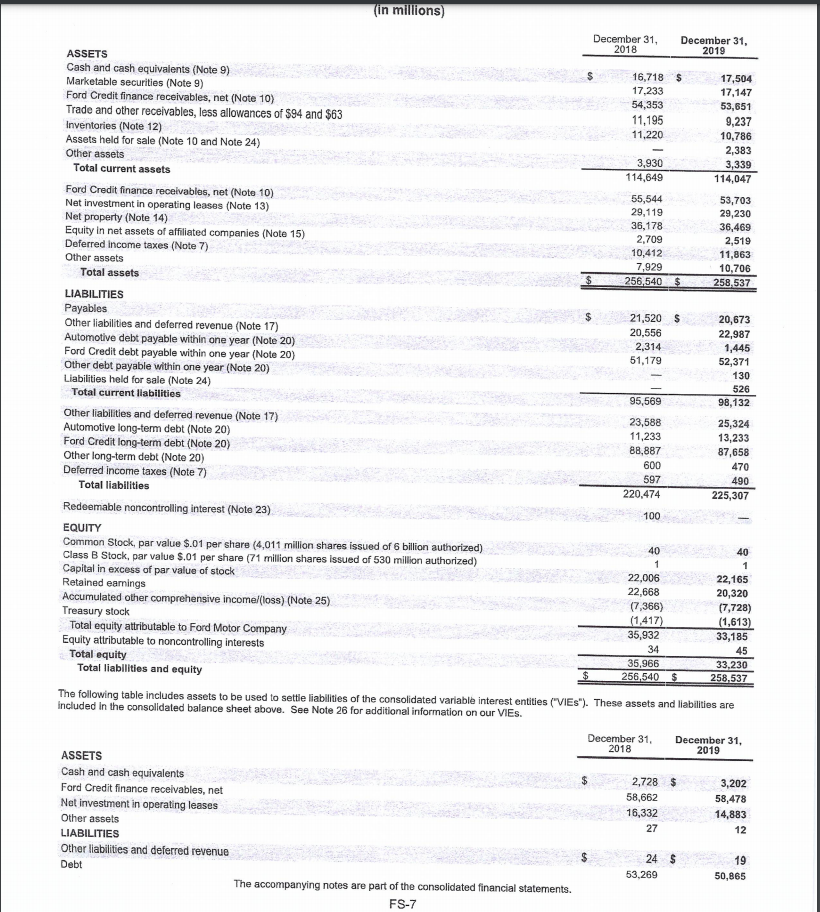
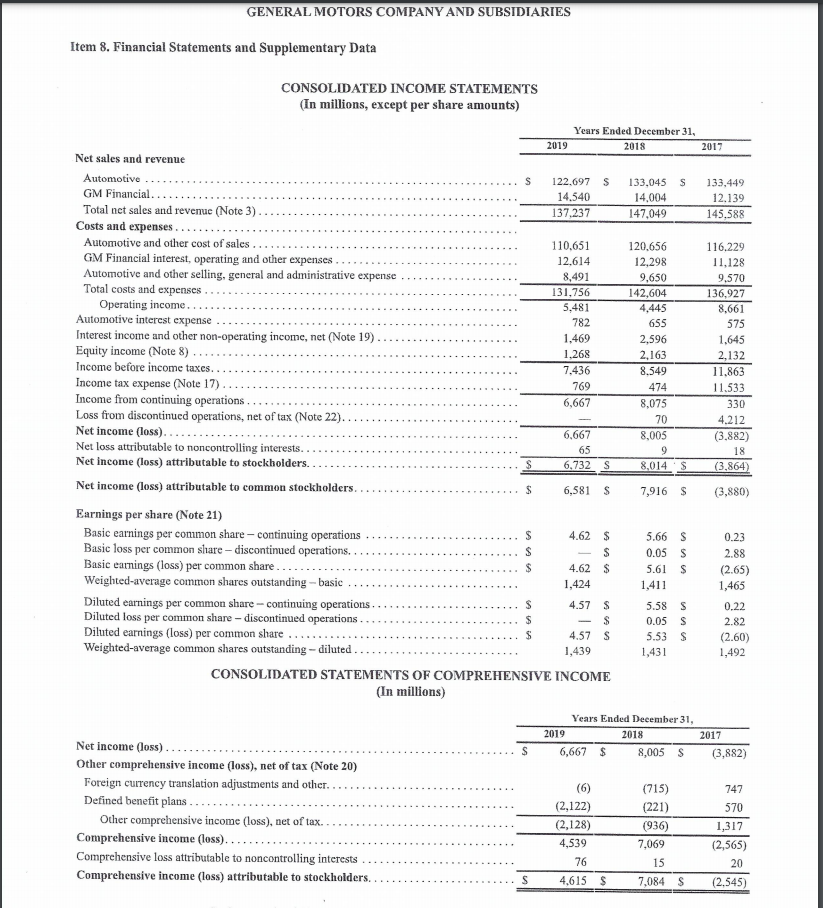
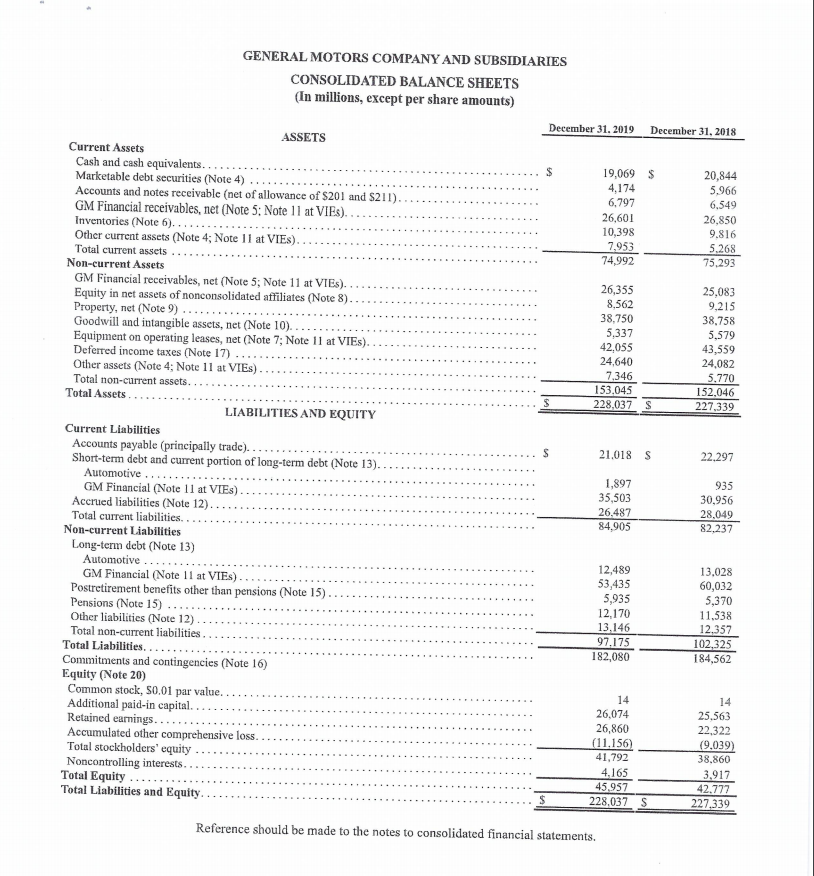
(in millions, except per share amounts) For the years ended December 31, 2017 2018 2019 Revenues Automotive Ford Credit Mobility Total revenues (Note 4) 145,653 $ 11,113 10 156,776 148,294 $ 12.018 26 160,338 143,599 12,260 41 155,900 Costs and expenses Cost of sales Selling, administrative, and other expenses Ford Credit interest, operating, and other expenses Total costs and expenses Operating income 131,321 11,527 9,047 151,895 4,881 136,269 11,403 9,463 157,135 3,203 134,693 11,161 9,472 155,326 574 Interest expense on Automotive debt Interest expense on other debt 1,133 57 1,171 57 963 57 Other Income (loss), net (Note 5) Equity in net income of affiliated companies Income (Loss) before income taxes Provision forl(Benefit from) income taxes (Note 7) Net income Less: Income attributable to noncontrolling interests Net income attributable to Ford Motor Company 3,267 1,201 8,159 402 7,757 26 7,731 $ 2,247 123 4,345 650 3,695 18 3,677 $ (226) 32 (640) (724) 84 37 47 $ EARNINGS PER SHARE ATTRIBUTABLE TO FORD MOTOR COMPANY COMMON AND CLASS B STOCK (Note 8) Basic income Diluted income $ 1.94 $ 1.93 0.93 0.92 0.01 0.01 Weighted-average shares used in computation of earnings per share Basic shares Diluted shares 3,975 3,998 3,974 3,998 3,972 4,004 CONSOLIDATED STATEMENT OF COMPREHENSIVE INCOME (in millions) $ For the years ended December 31, 2017 2018 2019 Net Income 7.757 $ 3,695 $ 84 Other comprehensive income/(loss), net of tax (Note 25) Foreign currency translation 314 (523) 174 Marketable securities (34) (11) 130 Derivative instruments (265) 183 (689) Pension and other postretirement benefits 37 (56) 23 Total other comprehensive income (loss), net of tax 52 (407) (362) Comprehensive income/(loss) 7,809 3,288 (278) Less: Comprehensive income (loss) attributable to noncontrolling interests 24 37 Comprehensive income (loss) attributable to Ford Motor Company $ 7,785 $ 3,270 $ (315) The accompanying notes are part of the consolidated financial statements 18 (in millions) December 31, December 31, 2018 2019 ASSETS Cash and cash equivalents (Note 9) 16,718 17,504 Marketable securities (Note 9) 17,233 17,147 Ford Credit finance receivables, net (Note 10) 54,353 53,651 Trade and other receivables, less allowances of $94 and $63 11,195 9,237 Inventories (Note 12) 11,220 10,786 Assets held for sale (Note 10 and Note 24) 2,383 Other assets 3,930 3,339 Total current assets 114,649 114,047 Ford Credit finance receivables, net (Note 10) 55,544 53,703 Net investment in operating leases (Note 13) 29,119 29,230 Net property (Note 14) 36,178 36,469 Equity in net assets of affiliated companies (Note 15) 2,709 2,519 Deferred income taxes (Note 7) 10,412 11,863 Other assets 7,929 10,706 Total assets 256,540 $ 258,537 LIABILITIES Payables 21,520 $ 20,673 Other liabilities and deferred revenue (Note 17) 20,556 22,987 Automotive debt payable within one year (Note 20) 2,314 1,445 Ford Credit debt payable within one year (Note 20) 51,179 52,371 Other debt payable within one year (Note 20) 130 Liabilities held for sale (Note 24) 526 Total current liabilities 95,569 98,132 Other liabilities and deferred revenue (Note 17) 23,588 25,324 Automotive long-term debt (Note 20) 11,233 13,233 Ford Credit long-term debt (Note 20) 88,887 87,658 Other long-term debt (Note 20) 600 470 Deferred income taxes (Note 7) 597 490 Total liabilities 220,474 225,307 Redeemable noncontrolling interest (Note 23) 100 EQUITY Common Stock, par value $.01 per share (4,011 million shares issued of 6 billion authorized) 40 40 Class B Stock, par value $.01 per share (71 million shares issued of 530 million authorized) 1 1 Capital in excess of par value of stock 22,006 22,165 Retained earnings 22,668 20,320 Accumulated other comprehensive income (los) (Note 25) (7,366) (7,728) Treasury stock (1,417) (1,613) Total equity attributable to Ford Motor Company 35,932 33,185 Equity attributable to noncontrolling interests 34 45 Total equity 35,966 33.230 Total liabilities and equity $ 256,540 $ 258.537 The following table includes assets to be used to settle liabilities of the consolidated variable interest entities ("VIES"). These assets and liabilities are included in the consolidated balance sheet above. See Note 26 for additional information on our VIEs. December 31 December 31, 2018 2019 ASSETS Cash and cash equivalents 2,728 $ 3,202 Ford Credit finance receivables, net 58,662 58,478 Net investment in operating leases 16,332 14,883 Other assets 27 12 LIABILITIES Other liabilities and deferred revenue 24 $ 19 Debt 53,269 50,865 The accompanying notes are part of the consolidated financial statements. FS-7 GENERAL MOTORS COMPANY AND SUBSIDIARIES Item 8. Financial Statements and Supplementary Data S 9 S CONSOLIDATED INCOME STATEMENTS (In millions, except per share amounts) Years Ended December 31, 2019 2018 2017 Net sales and revenue Automotive s 122.697 S 133,045 133,449 GM Financial.. 14.540 14.004 12,139 Total net sales and revenue (Note 3) 137.237 147,049 145.588 Costs and expenses Automotive and other cost of sales 110,651 120.656 116.229 GM Financial interest, operating and other expenses 12,614 12,298 11,128 Automotive and other selling, general and administrative expense 8.491 9,650 9,570 Total costs and expenses .. 131,756 142,604 136,927 Operating income... 5,481 4,445 8,661 Automotive interest expense 782 655 575 Interest income and other non-operating income, net (Note 19) 1,469 2,596 1,645 Equity income (Note 8) 1.268 2,163 2,132 Income before income taxes. 7,436 8.549 11.863 Income tax expense (Note 17) 769 474 11.533 Income from continuing operations. 6,667 8,075 330 Loss from discontinued operations, net of tax (Note 22). 70 4.212 Net income (loss).. 6,667 8,005 (3.882) Net loss attributable to noncontrolling interests. 65 18 Net income (loss) attributable to stockholders.. S 6.732 S 8,014 (3,864) Net income (loss) attributable to common stockholders.. S 6,581 7,916 $ (3,880) Earnings per share (Note 21) Basic earnings per conimon share - continuing operations $ 4.62 $ 5.66 S 0.23 Basic loss per common share - discontinued operations... S S 0.05 S 2.88 Basic earnings (loss) per common share.. $ 4.62 $ 5.61 S (2.65) Weighted-average common shares outstanding - basic 1,424 1,411 1,465 Diluted earnings per common share - continuing operations S 4.57 $ 5.58 S 0.22 Diluted loss per common share - discontinued operations. $ $ 0.05 S 2.82 Diluted earnings (loss) per common share.... $ 4.57 S 5.53 S (2.60) Weighted average common shares outstanding - diluted 1,439 1,431 1,492 CONSOLIDATED STATEMENTS OF COMPREHENSIVE INCOME (In millions) Years Ended December 31, 2019 2018 2017 Net income (loss). S 6,667 $ 8,005 S (3,882) Other comprehensive income (loss), net of tax (Note 20) Foreign currency translation adjustments and other... (715) 747 Defined benefit plans (2,122) (221) 570 Other comprehensive income (loss), net of tax. (2,128) (936) 1,317 Comprehensive income (loss).., 4,539 7.069 (2,565) Comprehensive loss attributable to noncontrolling interests 76 15 20 Comprehensive income (Loss) attributable to stockholders. S 4.615 $ 7,084 $ (2,545) $ S GENERAL MOTORS COMPANY AND SUBSIDIARIES CONSOLIDATED BALANCE SHEETS (In millions, except per share amounts) December 31, 2019 December 31, 2018 ASSETS Current Assets Cash and cash equivalents.... 19,069 $ 20,844 Marketable debt securities (Note 4) 4,174 5.966 Accounts and notes receivable (net of allowance of $201 and $211). 6,797 6,549 GM Financial receivables, net (Note 5: Note 11 at VIES). 26,601 26,850 Inventories (Note 6)... 10,398 9.816 Other current assets (Note 4; Note 11 at VIES). 7,953 5.268 Total current assets 74,992 75,293 Non-current Assets GM Financial receivables, net (Note 5; Note 11 at VIES). 26,355 25,083 Equity in net assets of nonconsolidated affiliates (Note 8). 8,562 9,215 Property, net (Note 9) 38.750 Goodwill and intangible assets, net (Note 10). 38,758 5,337 5.579 Equipment on operating leases, net (Note 7; Note 11 at VIES). 42,055 43,559 Deferred income taxes (Note 17) 24,640 24,082 Other assets (Note 4; Note 11 at VIES) 7.346 5.770 Total non-current assets......... 153.045 152.046 Total Assets $ 228,037 S 227,339 LIABILITIES AND EQUITY Current Liabilities Accounts payable (principally trade).... S 21.018 S 22.297 Short-term debt and current portion of long-term debt (Note 13). Automotive .... 1,897 935 GM Financial (Note 11 at VIES) 35,503 30,956 Accrued liabilities (Note 12). 26,487 28.049 Total current liabilities 84,905 82.237 Non-current Liabilities Long-term debt (Note 13) Automotive 12,489 13,028 GM Financial (Note 11 at VIES). 53,435 60,032 Postretirement benefits other than pensions (Note 15). 5,935 5,370 Pensions (Note 15) 12,170 Other liabilities (Note 12) 11,538 13,146 12,357 Total non-current liabilities. 97,175 102,325 Total Liabilities..... 182,080 184,562 Commitments and contingencies (Note 16) Equity (Note 20) Common stock, 50.01 par value. 14 14 Additional paid-in capital. 26,074 25,563 Retained earnings.... 26,860 22.322 Accumulated other comprehensive loss. (11,156) Total stockholders' equity (9,039) 41,792 38.860 Noncontrolling interests. 4.165 3.917 Total Equity ... 45.957 42.777 Total Liabilities and Equity $ 228,037 S 227,339 Reference should be made to the notes to consolidated financial statements
Step by Step Solution
There are 3 Steps involved in it

Get step-by-step solutions from verified subject matter experts