

Question: Financial Statement Analysis Project Instructions For this project, you will use the provided financial statements for Google. Take 2021 information given and perform the required
Financial Statement Analysis Project
Instructions
For this project, you will use the provided financial statements for Google. Take 2021 information given and perform the required financial ratios listed below. Compare the ratios of 2021 and 2022 . In comparing the ratios you will need to discuss which company has a better ratio, justify your rationale, and explain your findings in detail in your analysis. Write at least one paragraph discussing your results for each ratio.
Part 1:
What is the ratio used for, what is its purpose?
Write out formula
Fill out formula using the two years financial statement information for both companies
Your interpretation of ratio in at least one paragraph
Part 2: For each of the four categories of ratios, identify what the four categories are, and in your own words, explain the following
Who are the main stakeholders?
What are they assessing?
Why are they assessing it?
Part 1
Ford-2019 GM-2019
Profitability
Earnings Per Share
1)
2)
3)
4)
Return on Total Assets
1)
2)
3)
4)
Return on Equity
1)
2)
3)
4)
Profit Margin Ratio
1)
2)
3)
4)
Gross Margin Ratio
1)
2)
3)
4)
Solvency/Leverage
Debt Ratio
1)
2)
3)
4)
Equity Ratio
1)
2)
3)
4)
Debt to Equity Ratio
1)
2)
3)
4)
Times Interest Earned
1)
2)
3)
4)
Liquidity and Efficiency
Current Ratio
1)
2)
3)
4)
Acid-Test Ratio
1)
2)
3)
4)
Accounts Receivable Turnover
1)
2)
3)
4)
Inventory Turnover
1)
2)
3)
4)
Days Sales Uncollected
1)
2)
3)
4)
Days Sales in Inventory
1)
2)
3)
4)
Total Asset Turnover
1)
2)
3)
4)
Market Prospects
Price-earnings Ratio
1)
2)
3)
4)
Dividend Yield
1)
2)
3)
4)
Part 2
Category 1:
Who are the main stakeholders?
What are they assessing?
Why are they assessing it?
Category 2:
Who are the main stakeholders?
What are they assessing?
Why are they assessing it?
Category 3:
Who are the main stakeholders?
What are they assessing?
Why are they assessing it?
Category 4:
Who are the main stakeholders?
What are they assessing?
Why are they assessing it?
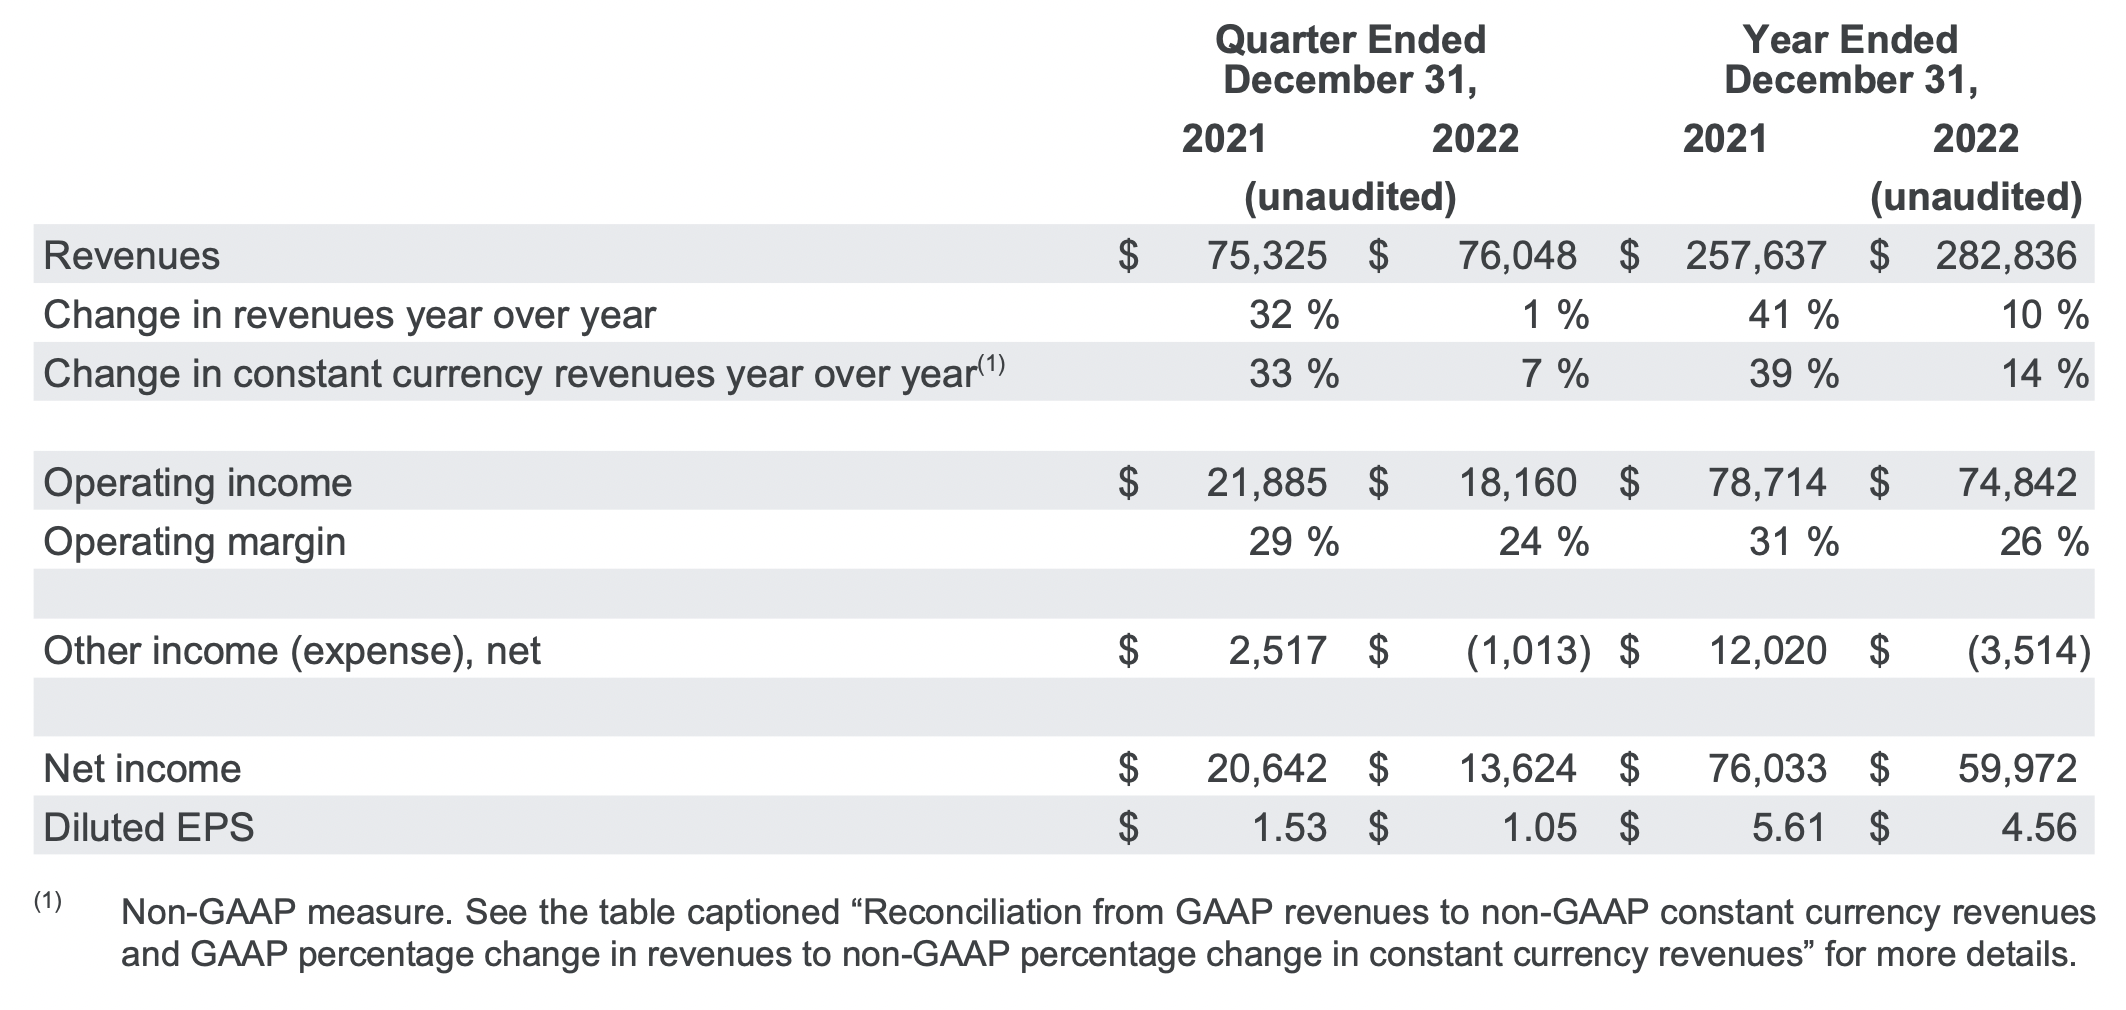
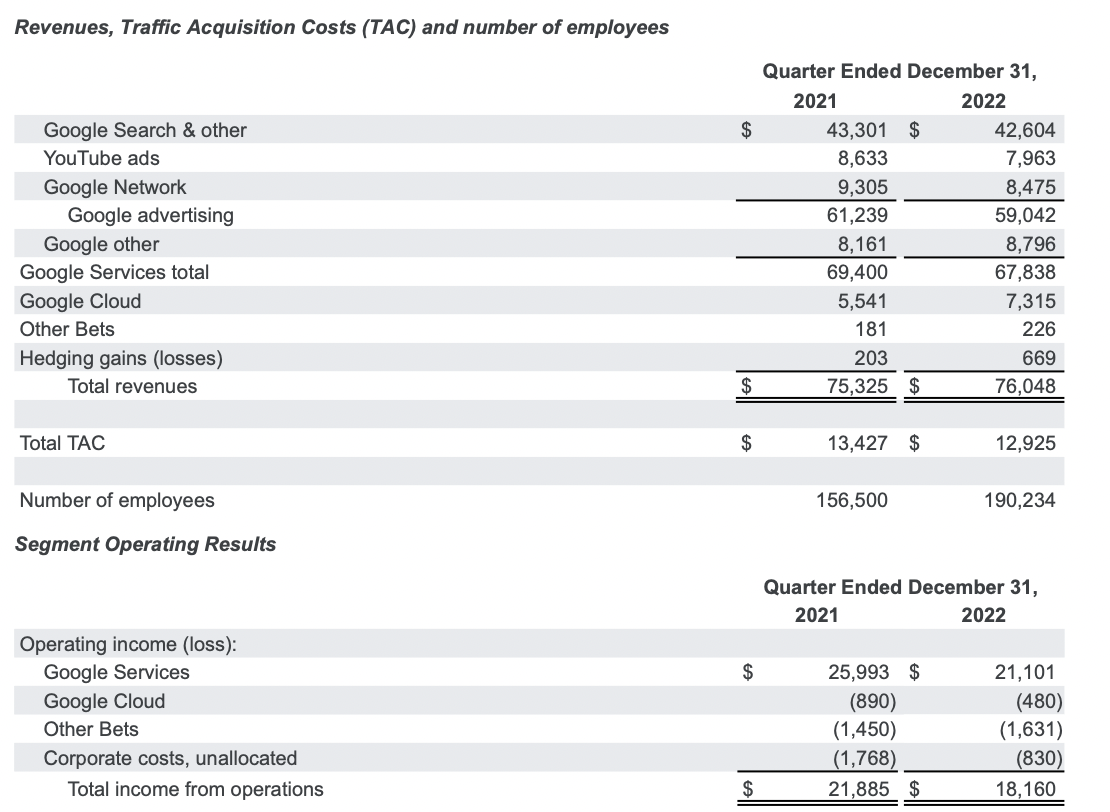
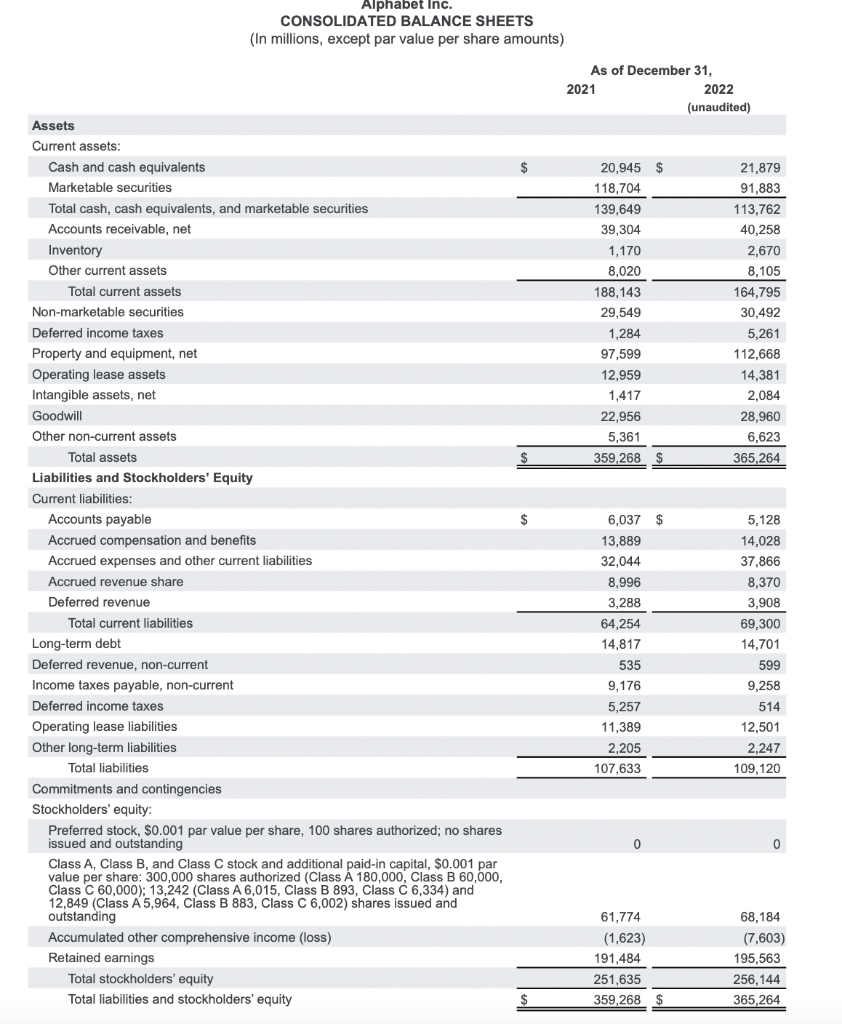
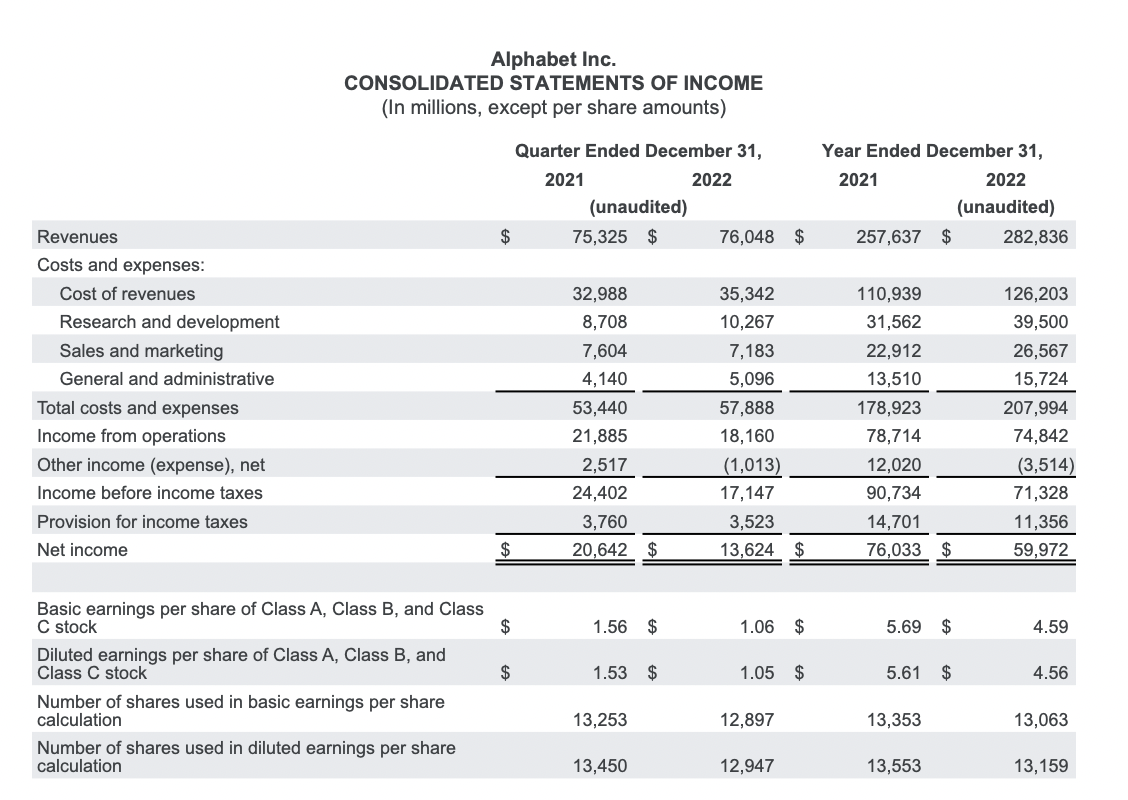
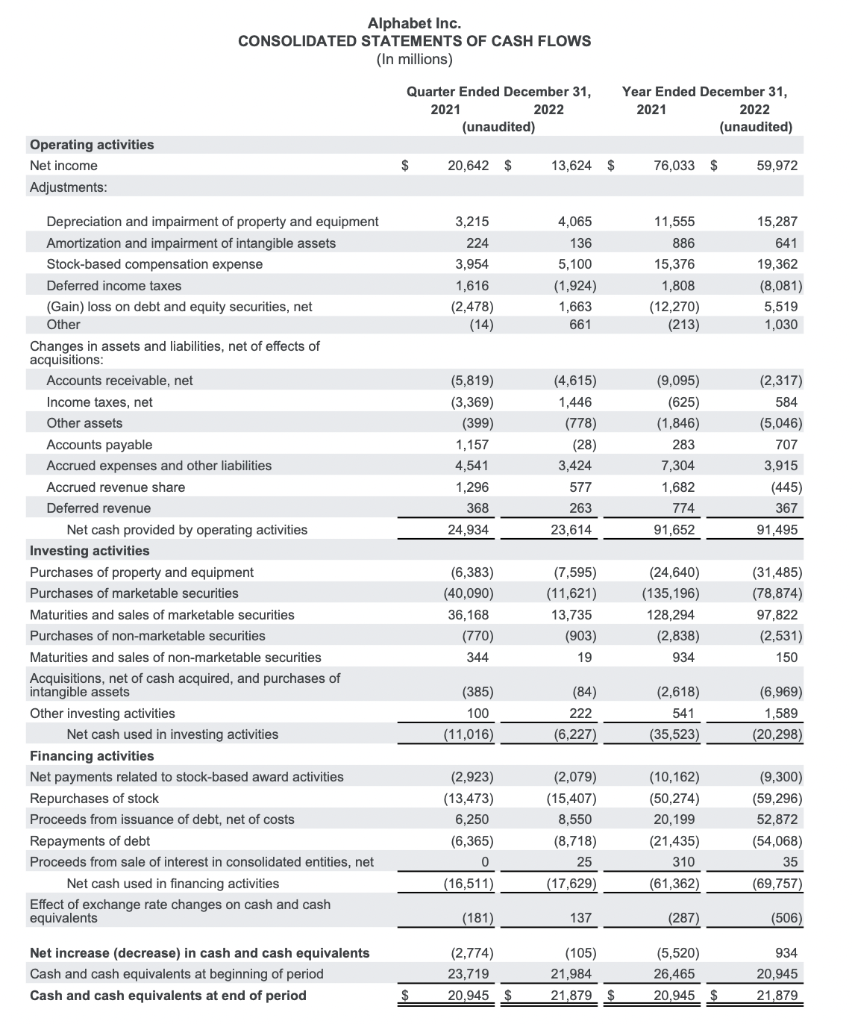
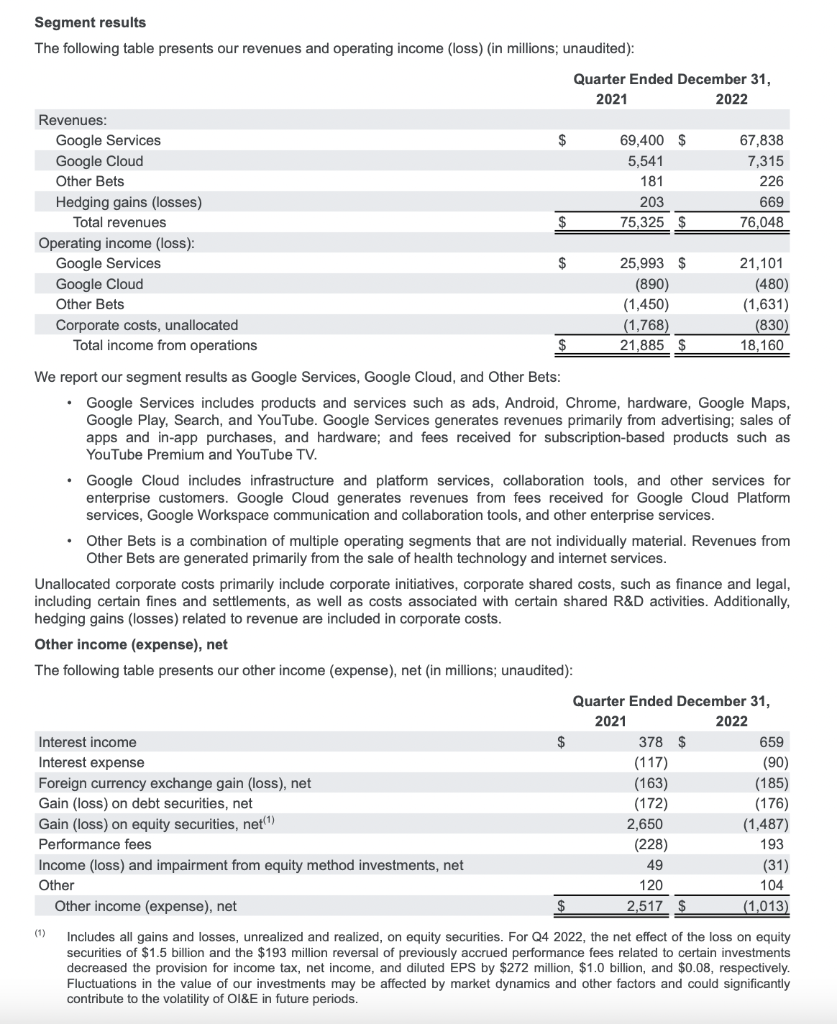
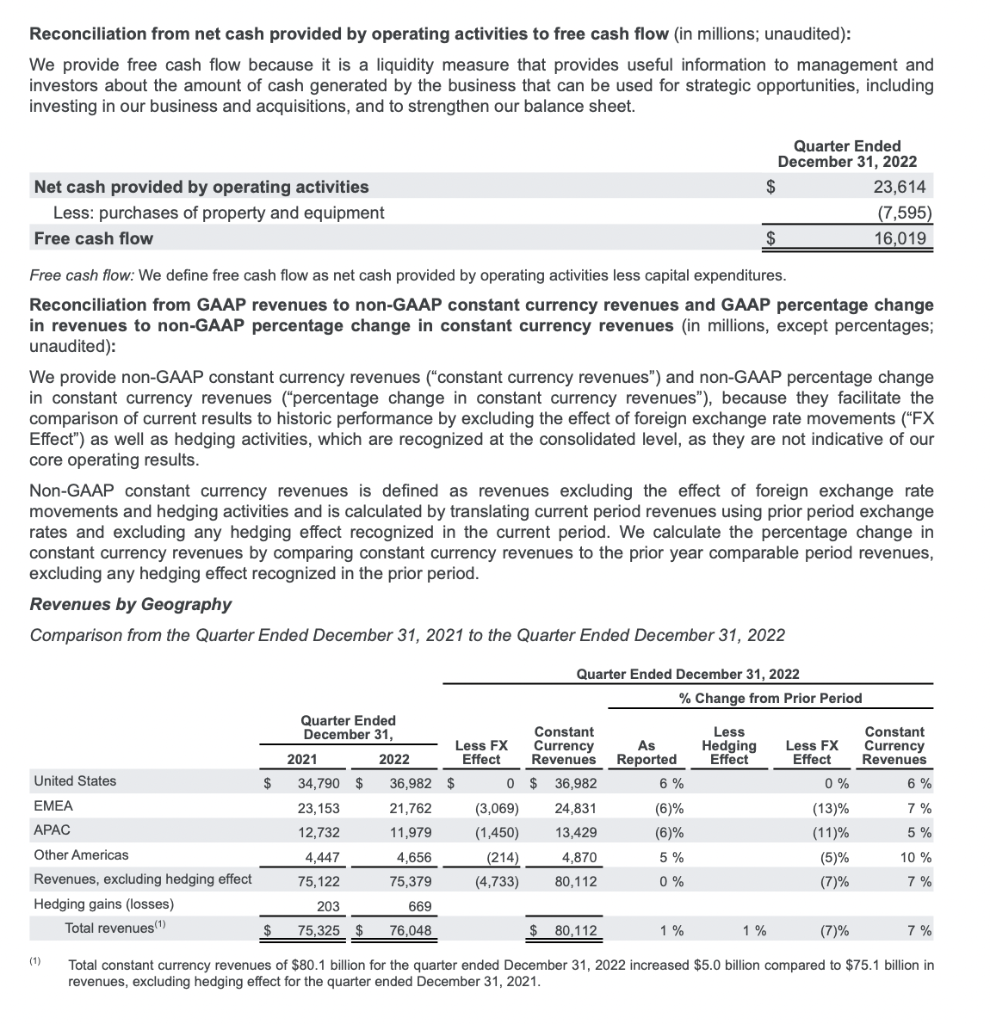
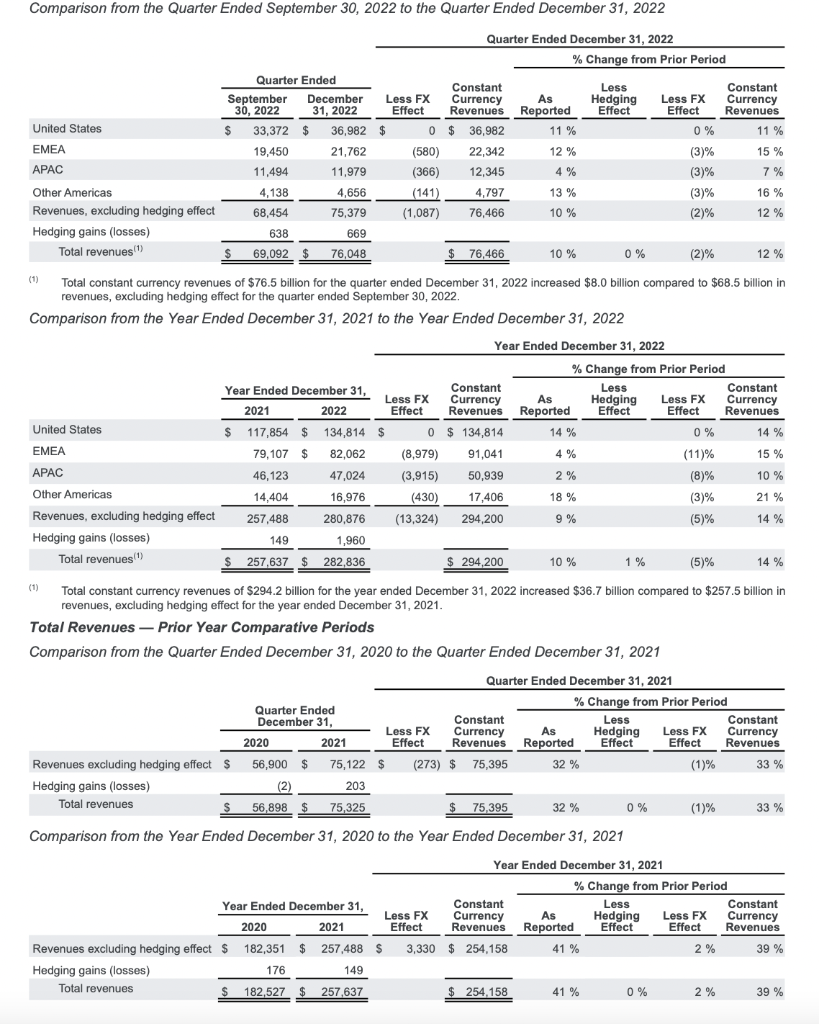
and GAAP percentage change in revenues to non-GAAP percentage change in constant currency revenues" for more details. Revenues, Traffic Acquisition Costs (TAC) and number of employees CONSOLIDATED BALANCE SHEETS (In millions, except par value per share amounts) Alphabet Inc. CONSOLIDATED STATEMENTS OF INCOME Alphabet Inc. Segment results The following table presents our revenues and operating income (loss) (in millions; unaudited): We report our segment results as Google Services, Google Cloud, and Other Bets: - Google Services includes products and services such as ads, Android, Chrome, hardware, Google Maps, Google Play, Search, and YouTube. Google Services generates revenues primarily from advertising; sales of apps and in-app purchases, and hardware; and fees received for subscription-based products such as YouTube Premium and YouTube TV. - Google Cloud includes infrastructure and platform services, collaboration tools, and other services for enterprise customers. Google Cloud generates revenues from fees received for Google Cloud Platform services, Google Workspace communication and collaboration tools, and other enterprise services. - Other Bets is a combination of multiple operating segments that are not individually material. Revenues from Other Bets are generated primarily from the sale of health technology and internet services. Unallocated corporate costs primarily include corporate initiatives, corporate shared costs, such as finance and legal, including certain fines and settlements, as well as costs associated with certain shared R\&D activities. Additionally, hedging gains (losses) related to revenue are included in corporate costs. Other income (expense), net The following table presents our other income (expense), net (in millions; unaudited): (1) Includes all gains and losses, unrealized and realized, on equity securities. For Q4 2022, the net effect of the loss on equity securities of $1.5 billion and the $193 million reversal of previously accrued performance fees related to certain investments decreased the provision for income tax, net income, and diluted EPS by $272 million, $1.0 billion, and $0.08, respectively. Fluctuations in the value of our investments may be affected by market dynamics and other factors and could significantly contribute to the volatility of OI\&E in future periods. Reconciliation from net cash provided by operating activities to free cash flow (in millions; unaudited): We provide free cash flow because it is a liquidity measure that provides useful information to management and investors about the amount of cash generated by the business that can be used for strategic opportunities, including investing in our business and acquisitions, and to strengthen our balance sheet. Free cash flow: We define free cash flow as net cash provided by operating activities less capital expenditures. Reconciliation from GAAP revenues to non-GAAP constant currency revenues and GAAP percentage change in revenues to non-GAAP percentage change in constant currency revenues (in millions, except percentages; unaudited): We provide non-GAAP constant currency revenues ("constant currency revenues") and non-GAAP percentage change in constant currency revenues ("percentage change in constant currency revenues"), because they facilitate the comparison of current results to historic performance by excluding the effect of foreign exchange rate movements ("FX Effect") as well as hedging activities, which are recognized at the consolidated level, as they are not indicative of our core operating results. Non-GAAP constant currency revenues is defined as revenues excluding the effect of foreign exchange rate movements and hedging activities and is calculated by translating current period revenues using prior period exchange rates and excluding any hedging effect recognized in the current period. We calculate the percentage change in constant currency revenues by comparing constant currency revenues to the prior year comparable period revenues, excluding any hedging effect recognized in the prior period. Revenues by Geography Comparison from the Quarter Ended December 31, 2021 to the Quarter Ended December 31, 2022 (1) Total constant currency revenues of $80.1 billion for the quarter ended December 31,2022 increased $5.0 billion compared to $75.1 billion in revenues, excluding hedging effect for the quarter ended December 31,2021. (1) Total constant currency revenues of $76.5 billion for the quarter ended December 31,2022 increased $8.0 billion compared to $68.5 billion in revenues, excluding hedging effect for the quarter ended September 30, 2022. Comparison from the Year Ended December 31, 2021 to the Year Ended December 31, 2022 (1) Total constant currency revenues of $294.2 billion for the year ended December 31,2022 increased $36.7 billion compared to $257.5 billion in revenues, excluding hedging effect for the year ended December 31,2021. Total Revenues - Prior Year Comparative Periods Comparison from the Quarter Ended December 31, 2020 to the Quarter Ended December 31, 2021 Comparison from the Year Ended December 31, 2020 to the Year Ended December 31, 2021
Step by Step Solution
There are 3 Steps involved in it

Get step-by-step solutions from verified subject matter experts