

Question: Financial Highlights Technical Analysis Chart -Candle Stick Required: - Explain whether to buy, hold or sell. - Its impact on the share price performance. F&N
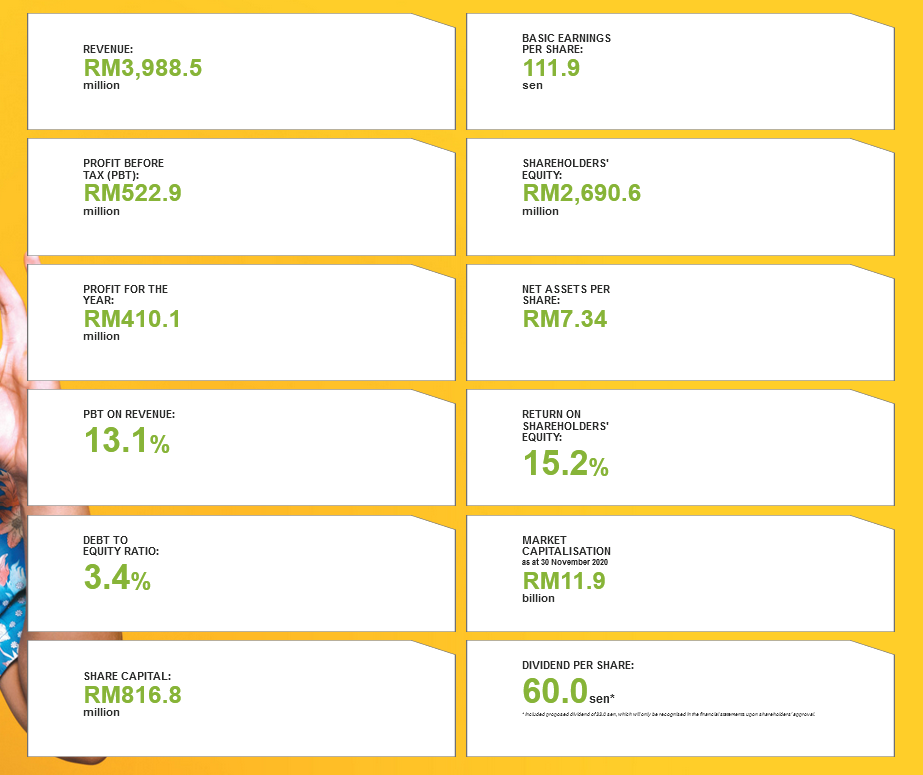
Financial Highlights
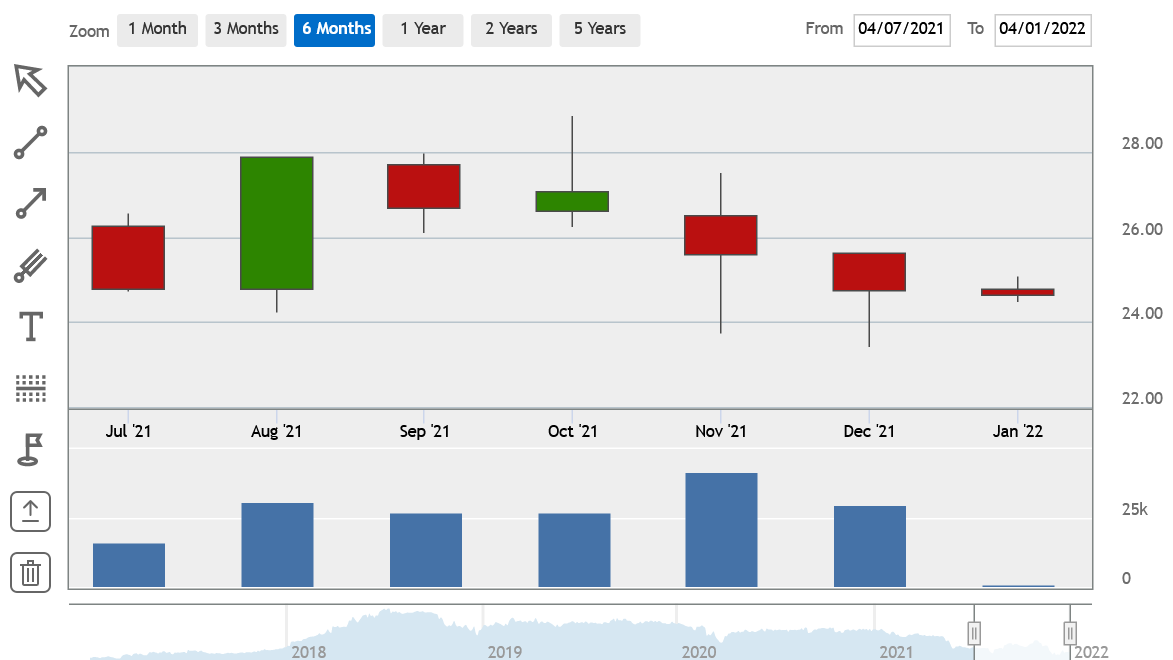
Technical Analysis Chart -Candle Stick
Required:
- Explain whether to buy, hold or sell.
- Its impact on the share price performance.
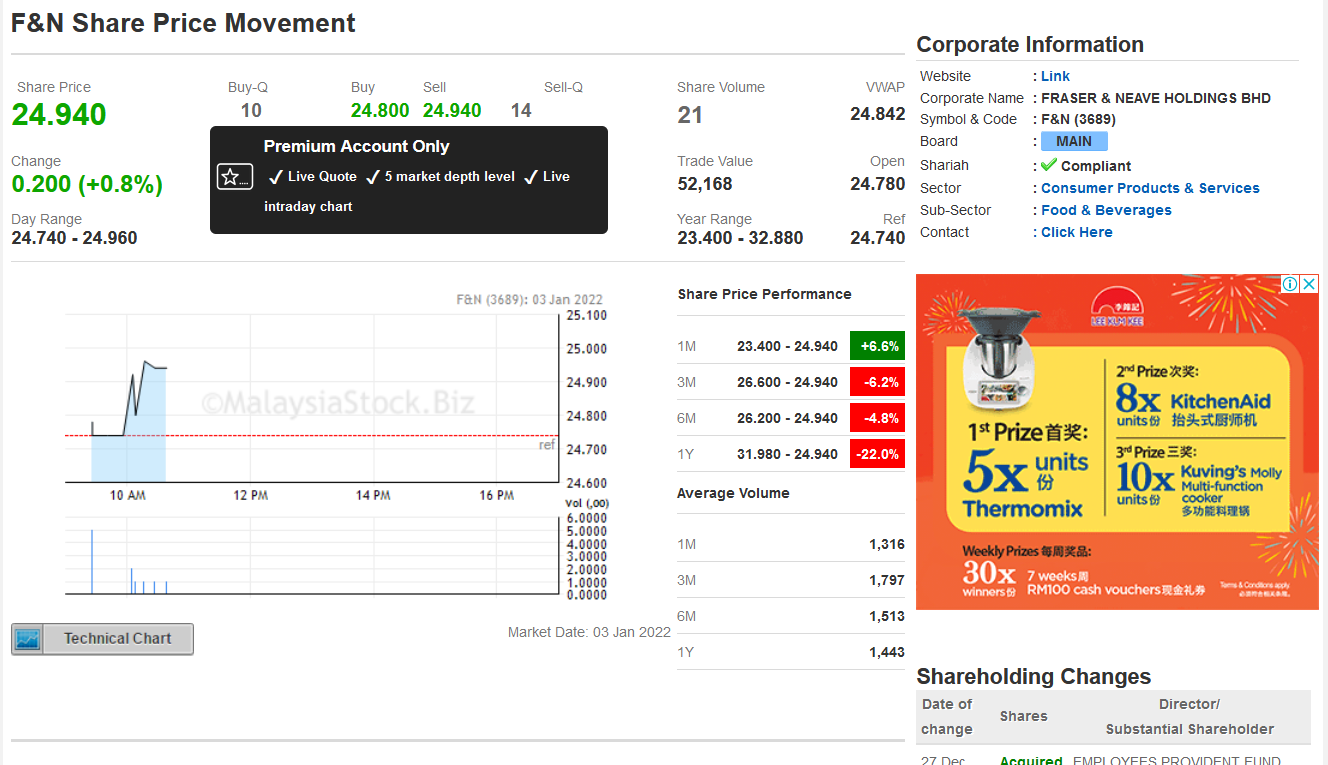
F&N Share Price Movement Share Price 24.940 Change 0.200 (+0.8%) Day Range 24.740 - 24.960 Buy-Q 10 Buy Sell 24.800 24.940 14 Premium Account Only Sell-Q Share Volume 21 Live Quote 5 market depth level Live intraday chart Trade Value 52,168 Year Range 23.400 - 32.880 Corporate Information Website : Link VWAP Corporate Name : FRASER & NEAVE HOLDINGS BHD 24.842 Symbol & Code : F&N (3689) Board Open Shariah 24.780 Sector Ref Sub-Sector 24.740 Contact MAIN Compliant : Consumer Products & Services : Food & Beverages : Click Here F&N (3689): 03 Jan 2022 Share Price Performance 25.100 BEE XUKEE 25.000 1M 23.400-24.940 +6.6% 24.900 3M 26.600 - 24.940 -6.2% MalaysiaStock.Biz 24.800 6M 26.200 - 24.940 -4.8% 1st Prize: 24.700 1Y 31.980 - 24.940 -22.0% 24.600 10 AM 12 PM 14 PM 16 PM Average Volume vol (,00) 6.0000 5x units Thermomix 2nd Prize: 8x KitchenAid units 3rd Prize: 10x Kuving's Holly units Multi-function cooker 5.0000 4.0000 1M 1,316 3.0000 Weekly Prizes : 2.0000 1.0000 3M 1,797 0.0000 30x 7 weeks winners RM100 cash vouchers Toms & Conditions apply ORXAN 6M 1,513 Market Date: 03 Jan 2022 Technical Chart 1Y 1,443 Shareholding Changes Date of change Shares 27 Dec Director/ Substantial Shareholder Acquired EMPLOYEES PROVIDENT FUND x
Step by Step Solution
There are 3 Steps involved in it

Get step-by-step solutions from verified subject matter experts