

Question: Question 4. How much should be distributed in the form of dividend versus stock repurchase? Case 3 Petronas Gas Berhad: Dividend Payout Policy . Farid
Question
4. How much should be distributed in the form of dividend versus stock repurchase?
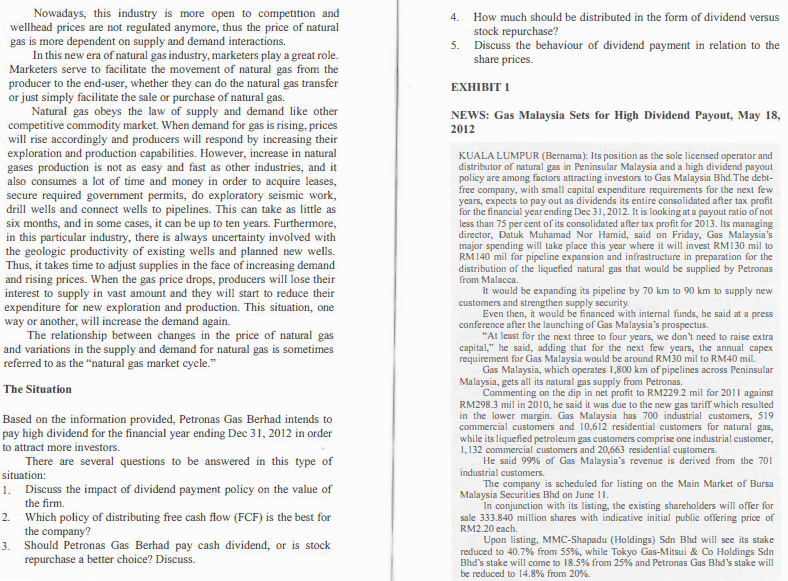
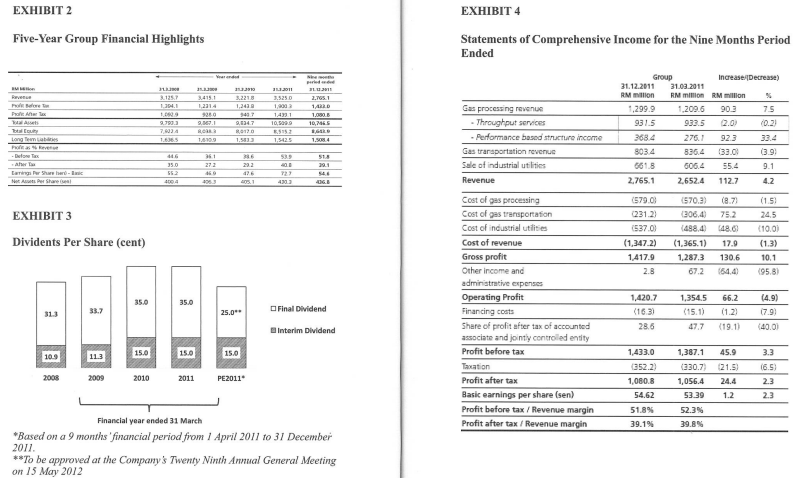
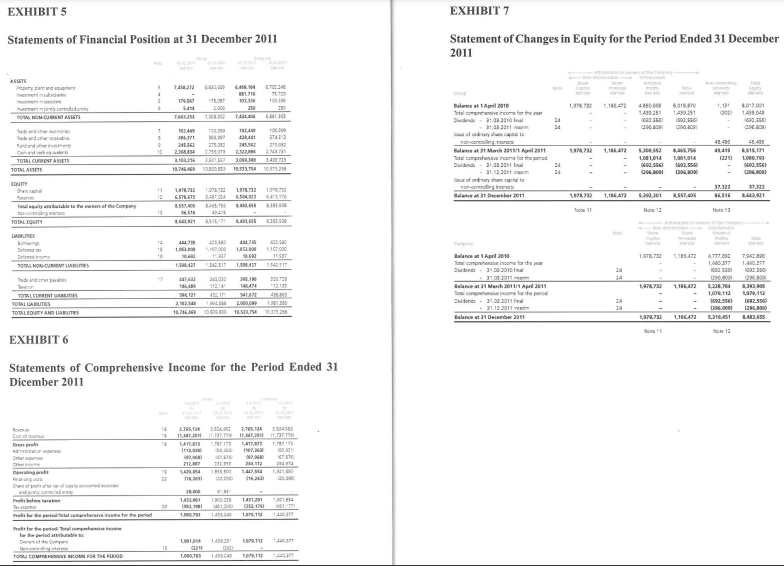
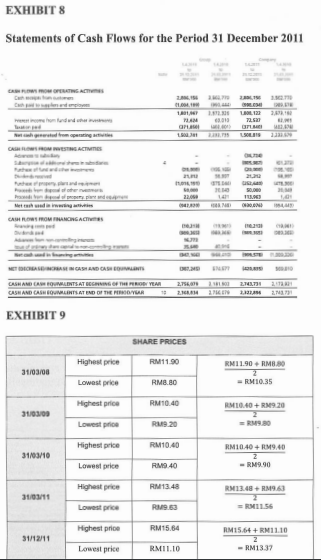
Case 3 Petronas Gas Berhad: Dividend Payout Policy . Farid was the Chief Financial Officer (CFO) for PETRONAS Gas when he read an article published in a local newspaper on Thursday, 18th of May, 2012 on Gas Malaysia's (its competitor) dividend policy that is set for high dividend payout as shown in Exhibit 1. Being the CFO of Petronas Gas Bhd., he gave a careful thought on whether the increment of dividend payout would be the right move or not for the firm. He was thinking whether would benefit the shareholders or he should choose another alternative. So he started to review the Petronas Gas Bhd's financial position. He knew then that the company has changed its financial year end from 31 March to 31 December yearly. The annual revenue reported was RM2,765.1 million which represents 4.2% increment from RM2,652.4 million, which was recorded in the last nine months period in the financial year of 2010/2011. This was due to a higher Gas Processing Revenue (GPR) and higher Industrial Utilities Revenue, which were RM90.3 million (an increase of 7.5%) and RM55.4 million (an increase of 9.1%) respectively. Farid compared the revenue from 31 March 2010 to 31 March 2011 and he could also see a 9.4% growth in revenue from RM3,221.8 million to RM3,525.0 million as shown in Exhibit 2, 3, and 4. Earnings Per Share (EPS) recorded a decrease from 72.8 cent to 54.5 cent, a considerable drop in 31 December 2011 compared to the nine months earlier. The decrease is due to the reporting of net income of the nine month period from RM1,439,049 to RM1,080,793 in the respective period. On the other hand, the financial statements illustrated that in the year 2010, EPS was 47.6 cent, and the company managed to increase EPS by 52.7% in March 2011. Based on the PGB's annual report, During the year, the Company paid interim dividend of 15 cent per share under the single tier system amounting to RM296.8 million. The Board of Directors recommended a final dividend of 25 cent per share under the single tier system, amounting to RM494.7 million with respect of the financial period ended 31 December 2011. This, together with the interim dividend, will result in total gross and net dividend of 40 cent per share, representing a payout ratio of 73.3% on the profit after tax for the financial period ended on 31 December 2011. A question crossed Farid's mind once again. Considering the increase of GBP's sales revenue in addition to other factors, should the company maintain a stable consistent payment policy or should they let payment vary as condition changes? Exhibit 5 to 8 shows PETRONAS Gas Berhad's Financial Statements for the period ended 31 March and 31 December 2011. The share Price Performance over the years is shown on exhibit 9. PETRONAS GAS BERHAD BACKGROUND PETRONAS Gas Berhad (PGB) was incorporated in 1983 and its main activities are processing and performing a series of transmission on natural gases in Malaysia. PGB's core business portfolio is divided into four major divisions; Plant Operations, Transmission Operations, Centralized Utility Facilities and Technical, as well as Facilities Development. The first two are directly related, whereby the former is responsible for processing the gas piped from PETRONAS' oil and gas fields offshore Peninsular Malaysia whilst the latter is responsible for transporting the processed gas via PGB's Peninsular Gas Utilization (PGU) pipeline network to PETRONAS' customers nationwide. The third division, which is the Centralized Utility Facilities and Technical, supports the gas value chain by supplying industrial utilities to various petrochemical plants operating in Kerteh, Terengganu and Gebeng, Pahang. The fourth division is a technical services outfit for PGB, which also extends its expertise in engineering and project management to other entities within the PETRONAS Group of Companies. PGB's growth and expansion involving new ventures also led to the establishment of a fifth full-fledged division, which is the Regasification Terminal Division. This new division is dedicated to oversee and drive the engineering, constructing, and commissioning the operations and maintenance of the country's first ever Liquefied Natural Gas (LNG) Regasification Facilities currently underway within the vicinity of Sungai Udang Port in Melaka and also other similar ventures in the near future. Natural gas from the offshore fields is processed at its six Gas Processing Plants. With total combined sales gas processing capacity of over 2,000 million, these gas processing plants process natural gas into sales gas and other by-products such as ethane, propane, and butane to be transmitted to PETRONAS customers in power and non-power sectors via PGB's Peninsular Gas Utilization pipeline network. The Transmission Operations Division is responsible for the transmission and delivery of sales gas to customers in the power, industrial, and commercial sectors throughout Peninsular and East Malaysia. In 1998, PGB expanded and diversified the business into manufacturing, supplying and marketing of industrial utility products to customers in Kerteh Integrated Petrochemical Complex and Gebeng Industrial Area through its Centralized Utility Facilities Division. PGB gives out a strong track record in transmission operations, whereby in 2007, it entered into an agreement with PETRONAS Carigali Sdn. Bhd. for the provision of project execution services on Sabah Sarawak Gas Pipeline project. Natural Gas Industry The structure of the natural gas industry has changed dramatically since the middle of 1980s. In the past, the structure of the natural gas industry was not seen as complicated at all. It has limited flexibility and few options for natural gas delivery. Moreover, the price of natural gas that each producer could charge to local distribution companies was regulated by the Malaysian Government and was monitored by related authority closely in order to prevent any unnecessary price fluctuation. However, this regulation caused less competitive market place and eventually led to natural gas shortage in the 1970s. Nowadays, this industry is more open to competition and wellhead prices are not regulated anymore, thus the price of natural gas is more dependent on supply and demand interactions. In this new era of natural gas industry, marketers play a great role. Marketers serve to facilitate the movement of natural gas from the producer to the end-user, whether they can do the natural gas transfer or just simply facilitate the sale or purchase of natural gas. Natural gas obeys the law of supply and demand like other competitive commodity market. When demand for gas is rising, prices will rise accordingly and producers will respond by increasing their exploration and production capabilities. However, increase in natural gases production is not as easy and fast as other industries, and it also consumes a lot of time and money in order to acquire leases, secure required government permits, do exploratory seismic work, drill wells and connect wells to pipelines. This can take as little as six months, and in some cases, it can be up to ten years. Furthermore, in this particular industry, there is always uncertainty involved with the geologic productivity of existing wells and planned new wells. Thus, it takes time to adjust supplies in the face of increasing demand and rising prices. When the gas price drops, producers will lose their interest to supply in vast amount and they will start to reduce their expenditure for new exploration and production. This situation, one way or another, will increase the demand again. The relationship between changes in the price of natural gas and variations in the supply and demand for natural gas is sometimes referred to as the "natural gas market cycle." The Situation Based on the information provided, Petronas Gas Berhad intends to pay high dividend for the financial year ending Dec 31, 2012 in order to attract more investors. There are several questions to be answered in this type of situation: 1. Discuss the impact of dividend payment policy on the value of the firm. 2. Which policy of distributing free cash flow (FCF) is the best for the company? 3. Should Petronas Gas Berhad pay cash dividend, or is stock repurchase a better choice? Discuss. 4. How much should be distributed in the form of dividend versus stock repurchase? 5. Discuss the behaviour of dividend payment in relation to the share prices. EXHIBIT 1 NEWS: Gas Malaysia Sets for High Dividend Payout, May 18, 2012 KUALA LUMPUR (Bernama). Its position as the sole licensed operator and distributor of natural gas in Peninsular Malaysia and a high dividend payout policy are among factors attracting investors to Gas Malaysia Bhd. The debt- free company, with small capital expenditure requirements for the next few years, expects to pay out as dividends its entire consolidated after tax profit for the financial year ending Dec 31, 2012. It is looking at a payout ratio of not less than 75 per cent of its consolidated after tax profit for 2013. Its managing director, Datuk Muhamad Nor Hamid, said on Friday, Gas Malaysia's major spending will take place this year where it will invest RM 130 mil to RM 140 mil for pipeline expansion and infrastructure in preparation for the distribution of the liquefied natural gas that would be supplied by Petronas from Malacca It would be expanding its pipeline by 70 km to 90 km to supply new customers and strengthen supply security Even then, it would be financed with internal funds, he said at a press conference after the launching of Gas Malaysia's prospectus. "At least for the next three to four years, we don't need to raise extra capital," he said, adding that for the next few years, the annual capex requirement for Gas Malaysia would be around RM30 mil to RM40 mil. Gas Malaysia, which operates 1,800 km of pipelines across Peninsular Malaysia, gets all its natural gas supply from Petronas. Commenting on the dip in net profit to RM229.2 mil for 2011 against RM298.3 mil in 2010, he said it was due to the new gas tariff which resulted in the lower margin. Gas Malaysia has 700 industrial customers, 519 commercial customers and 10,612 residential customers for natural gas, while its liquefied petroleum gas customers comprise one industrial customer, 1,132 commercial customers and 20,663 residential customers. He said 99% of Gas Malaysia's revenue is derived from the 701 industrial customers. The company is scheduled for listing on the Main Market of Bursa Malaysia Securities Bhd on June 11. In conjunction with its listing, the existing shareholders will offer for sale 333.840 million shares with indicative initial public offering price of RM2.20 each Upon listing. MMC-Shapadu (Holdings) Sdn Bhd will see its stake reduced to 40.7% from 55%, while Tokyo Gas-Mitsui & Co Holdings Sdn Bhd's stake will come to 18.5% from 25% and Petronas Gas Bhd's stake will be reduced to 14.8% from 20% EXHIBIT 4 EXHIBIT 2 Five-Year Group Financial Highlights Statements of Comprehensive Income for the Nine Months Period Ended Pere Palle Arte Tex 3.415.1 1.2314 90 2.125.7 101 1. 9.7903 7. 1.63 19.30 3.2218 1,243 1437 90347 9120 1.5833 35250 100 141 10 SOUD 11 2.7951 1A 1.000, 10,7455 ROR 1.6 Group Increase Decrease) 31.12.2011 31.03.2011 RM on RM milion RM million % 1,299.9 1.2006 903 75 931.5 933.5 2.0 (0.2) 276.1 923 33.4 3034 836.4 33.0 661.8 606.4 55.4 9.1 2.765.1 2,652.4 112.7 4.2 1,543 1.50 2684 Gas processing revenue - Throughput services - Performance based structure income Gas transportation revenue Sale of industrial utilities Revenue Longe PS 03.9 539 51 361 27.2 ahwa Laring Per Share hard- Net Aut. Per Shares 35.0 552 26 29.2 26 1 1983 4303 DGB EXHIBIT 3 Dividents Per Share (cent) (579.03 (231.2) (537.01 (1,347.2) 1,417.9 2.8 (570.3) 206.4 (498.4) (1.365.1) 1,287.3 67.2 (8.71 75.2 148.61 17.9 (1.51 24.5 (100) (1.3) 10.1 (95.8) 130.6 164.4 35.0 1.420.7 35.0 31.3 33.7 25.0 Final Dividend Cost of gas processing Cost of ons transportation Cost of industrial utilities Cost of revenue Gross profit Other income and administrative expenses Operating Profit Financing costs Share of profit after tax of accounted associate and jointly controlled entity Profit before tax Taxation Profit after tax Basic earnings per share (sen) Profit before tax / Revenue margin Profit after tax / Revenue margin (4.91 17.9 1,354.5 (15.1) 47.7 (1631 28.6 66.2 (1.2) (19.11 Interim Dividend 140.01 15.0 113 15.0 15.0 10.9 45.9 3.3 1,433.0 (352.2) 16.5) 2008 2009 1,387.1 (330.7 1,056.4 53.39 2010 2011 PE2011 (21.5) 24.4 1,080.8 2.3 1.2 54.62 51.8% 39.1% 52.39 39.89 Financial year ended 31 March *Based on a 9 months financial period from / 2011 to 31 December 2011. **To be approved at the Company's Twenty Ninth Annual General Meeting on /5 May 2012 EXHIBIT 5 EXHIBIT 7 Statements of Financial Position at 31 December 2011 Statement of Changes in Equity for the Period Ended 31 December 2011 ASHES Promo 71 773 1.778.732 8215.30 SAM TA TO NON CURENT ASEETS 250 TAL. Balance 2010 : Dividende - 10 na 8.013001 14.01 BAS GROSI 31 OM 1 TO AU 2 1.166.002 Pudine Ch TOTAL CURRENT ASSETS TOTAL ASSETS 25.52 2.36 2.1 17:09 75.51 2.790. 2. 2 2.502082343142 0312 4145 1418 220 443 15. LOTS 21 ro-corner Blue 31 March 2011 2011 To compressive Dividende - 9233 1230 mm autofony on.com Balance at 31 Dec 2011 15 LOLOT 600 SI 1092,96 1296.000 . TOUT LTL2 1.578.750 37.53 1772 6.STL 613 12 30 SABTU 3.4.150 37.322 16516 ce 1922 201 8,557,005 Tyritable at wwf the Company 11 Note 2011 TODLIQUITY LATES ALE Dette LIC.000 11 1.97730 L1.42 477 1.0.377 1. TOLOGIES SS SIT 1.54 MOLT 20 hund AU 1.4 33 11214 32T JIH 14AN 341022 Balance 3090 To companie income for the 10.2010 Balance March 2011 April 2011 To companion for the period Concs - 31.03.2011 21.12.2011 Balance at 31 December 2011 1.116.422 TOTALURINT TOTAL LABUTES TOTAL OUTY AND LIARES 5.230.766 1,006,112 192.556 296.00! L, 10 182.5560 129 130 42.555 10.06.2012,71 L72 1.186.422 Monta EXHIBIT 6 Statements of Comprehensive Income for the Period Ended 31 Dicember 2011 2.16.14 3.3.2.7.136.5452 11.57,3856 X I.P.S. 1.727.70 117,87 II ATTE IN 07.01 212 2 0035 1281 ORNI LIN 1 WS hulle we are alwave come to the period 14 w the periode Owes them TO COMPRESORIOS PERIOD 02 13 11 EXHIBITS Statements of Cash Flows for the Period 31 December 2011 2. COMO ETWAS Card metom iuddha Batangerted from spenning CROSON EST ACTIVITIES GPL 72. GP LOL MELINE we 22.000 Posted on my pred Methodning CARLOS ROMANCING ACTS MB 20,000 NASAGASH AND CASOS CASH AND CAMOWIENTS AT BEGINNING OF THE PERIOD YEAR 2.756.000 CASH AND CASHOIRLENTS AT END OF THE PROVUAR 2RM 278 2.70738 21 2.12.296 2117 EXHIBIT 9 SHARE PRICES Highest price RM11.90 RM11.90 + RM8.50 31/03/00 Lowest price RM8.80 = RM10.35 Highest price RM10.40 RM10.40 + RM9.20 31/03/00 Lowest price R19 20 = RM9.80 Highest price RM10.40 RM10.40 + RM9.40 31/03/10 Lowest price RM9.40 - RM9.90 Highest price RM 13.48 RM13.48 + RM9.53 31/03/11 Lowest price R9.63 =RM150 Highest price RM15.84 RM15.64 +RM11.10 31/12/11 Lowest price RM11.10 - RM13.37 Case 3 Petronas Gas Berhad: Dividend Payout Policy . Farid was the Chief Financial Officer (CFO) for PETRONAS Gas when he read an article published in a local newspaper on Thursday, 18th of May, 2012 on Gas Malaysia's (its competitor) dividend policy that is set for high dividend payout as shown in Exhibit 1. Being the CFO of Petronas Gas Bhd., he gave a careful thought on whether the increment of dividend payout would be the right move or not for the firm. He was thinking whether would benefit the shareholders or he should choose another alternative. So he started to review the Petronas Gas Bhd's financial position. He knew then that the company has changed its financial year end from 31 March to 31 December yearly. The annual revenue reported was RM2,765.1 million which represents 4.2% increment from RM2,652.4 million, which was recorded in the last nine months period in the financial year of 2010/2011. This was due to a higher Gas Processing Revenue (GPR) and higher Industrial Utilities Revenue, which were RM90.3 million (an increase of 7.5%) and RM55.4 million (an increase of 9.1%) respectively. Farid compared the revenue from 31 March 2010 to 31 March 2011 and he could also see a 9.4% growth in revenue from RM3,221.8 million to RM3,525.0 million as shown in Exhibit 2, 3, and 4. Earnings Per Share (EPS) recorded a decrease from 72.8 cent to 54.5 cent, a considerable drop in 31 December 2011 compared to the nine months earlier. The decrease is due to the reporting of net income of the nine month period from RM1,439,049 to RM1,080,793 in the respective period. On the other hand, the financial statements illustrated that in the year 2010, EPS was 47.6 cent, and the company managed to increase EPS by 52.7% in March 2011. Based on the PGB's annual report, During the year, the Company paid interim dividend of 15 cent per share under the single tier system amounting to RM296.8 million. The Board of Directors recommended a final dividend of 25 cent per share under the single tier system, amounting to RM494.7 million with respect of the financial period ended 31 December 2011. This, together with the interim dividend, will result in total gross and net dividend of 40 cent per share, representing a payout ratio of 73.3% on the profit after tax for the financial period ended on 31 December 2011. A question crossed Farid's mind once again. Considering the increase of GBP's sales revenue in addition to other factors, should the company maintain a stable consistent payment policy or should they let payment vary as condition changes? Exhibit 5 to 8 shows PETRONAS Gas Berhad's Financial Statements for the period ended 31 March and 31 December 2011. The share Price Performance over the years is shown on exhibit 9. PETRONAS GAS BERHAD BACKGROUND PETRONAS Gas Berhad (PGB) was incorporated in 1983 and its main activities are processing and performing a series of transmission on natural gases in Malaysia. PGB's core business portfolio is divided into four major divisions; Plant Operations, Transmission Operations, Centralized Utility Facilities and Technical, as well as Facilities Development. The first two are directly related, whereby the former is responsible for processing the gas piped from PETRONAS' oil and gas fields offshore Peninsular Malaysia whilst the latter is responsible for transporting the processed gas via PGB's Peninsular Gas Utilization (PGU) pipeline network to PETRONAS' customers nationwide. The third division, which is the Centralized Utility Facilities and Technical, supports the gas value chain by supplying industrial utilities to various petrochemical plants operating in Kerteh, Terengganu and Gebeng, Pahang. The fourth division is a technical services outfit for PGB, which also extends its expertise in engineering and project management to other entities within the PETRONAS Group of Companies. PGB's growth and expansion involving new ventures also led to the establishment of a fifth full-fledged division, which is the Regasification Terminal Division. This new division is dedicated to oversee and drive the engineering, constructing, and commissioning the operations and maintenance of the country's first ever Liquefied Natural Gas (LNG) Regasification Facilities currently underway within the vicinity of Sungai Udang Port in Melaka and also other similar ventures in the near future. Natural gas from the offshore fields is processed at its six Gas Processing Plants. With total combined sales gas processing capacity of over 2,000 million, these gas processing plants process natural gas into sales gas and other by-products such as ethane, propane, and butane to be transmitted to PETRONAS customers in power and non-power sectors via PGB's Peninsular Gas Utilization pipeline network. The Transmission Operations Division is responsible for the transmission and delivery of sales gas to customers in the power, industrial, and commercial sectors throughout Peninsular and East Malaysia. In 1998, PGB expanded and diversified the business into manufacturing, supplying and marketing of industrial utility products to customers in Kerteh Integrated Petrochemical Complex and Gebeng Industrial Area through its Centralized Utility Facilities Division. PGB gives out a strong track record in transmission operations, whereby in 2007, it entered into an agreement with PETRONAS Carigali Sdn. Bhd. for the provision of project execution services on Sabah Sarawak Gas Pipeline project. Natural Gas Industry The structure of the natural gas industry has changed dramatically since the middle of 1980s. In the past, the structure of the natural gas industry was not seen as complicated at all. It has limited flexibility and few options for natural gas delivery. Moreover, the price of natural gas that each producer could charge to local distribution companies was regulated by the Malaysian Government and was monitored by related authority closely in order to prevent any unnecessary price fluctuation. However, this regulation caused less competitive market place and eventually led to natural gas shortage in the 1970s. Nowadays, this industry is more open to competition and wellhead prices are not regulated anymore, thus the price of natural gas is more dependent on supply and demand interactions. In this new era of natural gas industry, marketers play a great role. Marketers serve to facilitate the movement of natural gas from the producer to the end-user, whether they can do the natural gas transfer or just simply facilitate the sale or purchase of natural gas. Natural gas obeys the law of supply and demand like other competitive commodity market. When demand for gas is rising, prices will rise accordingly and producers will respond by increasing their exploration and production capabilities. However, increase in natural gases production is not as easy and fast as other industries, and it also consumes a lot of time and money in order to acquire leases, secure required government permits, do exploratory seismic work, drill wells and connect wells to pipelines. This can take as little as six months, and in some cases, it can be up to ten years. Furthermore, in this particular industry, there is always uncertainty involved with the geologic productivity of existing wells and planned new wells. Thus, it takes time to adjust supplies in the face of increasing demand and rising prices. When the gas price drops, producers will lose their interest to supply in vast amount and they will start to reduce their expenditure for new exploration and production. This situation, one way or another, will increase the demand again. The relationship between changes in the price of natural gas and variations in the supply and demand for natural gas is sometimes referred to as the "natural gas market cycle." The Situation Based on the information provided, Petronas Gas Berhad intends to pay high dividend for the financial year ending Dec 31, 2012 in order to attract more investors. There are several questions to be answered in this type of situation: 1. Discuss the impact of dividend payment policy on the value of the firm. 2. Which policy of distributing free cash flow (FCF) is the best for the company? 3. Should Petronas Gas Berhad pay cash dividend, or is stock repurchase a better choice? Discuss. 4. How much should be distributed in the form of dividend versus stock repurchase? 5. Discuss the behaviour of dividend payment in relation to the share prices. EXHIBIT 1 NEWS: Gas Malaysia Sets for High Dividend Payout, May 18, 2012 KUALA LUMPUR (Bernama). Its position as the sole licensed operator and distributor of natural gas in Peninsular Malaysia and a high dividend payout policy are among factors attracting investors to Gas Malaysia Bhd. The debt- free company, with small capital expenditure requirements for the next few years, expects to pay out as dividends its entire consolidated after tax profit for the financial year ending Dec 31, 2012. It is looking at a payout ratio of not less than 75 per cent of its consolidated after tax profit for 2013. Its managing director, Datuk Muhamad Nor Hamid, said on Friday, Gas Malaysia's major spending will take place this year where it will invest RM 130 mil to RM 140 mil for pipeline expansion and infrastructure in preparation for the distribution of the liquefied natural gas that would be supplied by Petronas from Malacca It would be expanding its pipeline by 70 km to 90 km to supply new customers and strengthen supply security Even then, it would be financed with internal funds, he said at a press conference after the launching of Gas Malaysia's prospectus. "At least for the next three to four years, we don't need to raise extra capital," he said, adding that for the next few years, the annual capex requirement for Gas Malaysia would be around RM30 mil to RM40 mil. Gas Malaysia, which operates 1,800 km of pipelines across Peninsular Malaysia, gets all its natural gas supply from Petronas. Commenting on the dip in net profit to RM229.2 mil for 2011 against RM298.3 mil in 2010, he said it was due to the new gas tariff which resulted in the lower margin. Gas Malaysia has 700 industrial customers, 519 commercial customers and 10,612 residential customers for natural gas, while its liquefied petroleum gas customers comprise one industrial customer, 1,132 commercial customers and 20,663 residential customers. He said 99% of Gas Malaysia's revenue is derived from the 701 industrial customers. The company is scheduled for listing on the Main Market of Bursa Malaysia Securities Bhd on June 11. In conjunction with its listing, the existing shareholders will offer for sale 333.840 million shares with indicative initial public offering price of RM2.20 each Upon listing. MMC-Shapadu (Holdings) Sdn Bhd will see its stake reduced to 40.7% from 55%, while Tokyo Gas-Mitsui & Co Holdings Sdn Bhd's stake will come to 18.5% from 25% and Petronas Gas Bhd's stake will be reduced to 14.8% from 20% EXHIBIT 4 EXHIBIT 2 Five-Year Group Financial Highlights Statements of Comprehensive Income for the Nine Months Period Ended Pere Palle Arte Tex 3.415.1 1.2314 90 2.125.7 101 1. 9.7903 7. 1.63 19.30 3.2218 1,243 1437 90347 9120 1.5833 35250 100 141 10 SOUD 11 2.7951 1A 1.000, 10,7455 ROR 1.6 Group Increase Decrease) 31.12.2011 31.03.2011 RM on RM milion RM million % 1,299.9 1.2006 903 75 931.5 933.5 2.0 (0.2) 276.1 923 33.4 3034 836.4 33.0 661.8 606.4 55.4 9.1 2.765.1 2,652.4 112.7 4.2 1,543 1.50 2684 Gas processing revenue - Throughput services - Performance based structure income Gas transportation revenue Sale of industrial utilities Revenue Longe PS 03.9 539 51 361 27.2 ahwa Laring Per Share hard- Net Aut. Per Shares 35.0 552 26 29.2 26 1 1983 4303 DGB EXHIBIT 3 Dividents Per Share (cent) (579.03 (231.2) (537.01 (1,347.2) 1,417.9 2.8 (570.3) 206.4 (498.4) (1.365.1) 1,287.3 67.2 (8.71 75.2 148.61 17.9 (1.51 24.5 (100) (1.3) 10.1 (95.8) 130.6 164.4 35.0 1.420.7 35.0 31.3 33.7 25.0 Final Dividend Cost of gas processing Cost of ons transportation Cost of industrial utilities Cost of revenue Gross profit Other income and administrative expenses Operating Profit Financing costs Share of profit after tax of accounted associate and jointly controlled entity Profit before tax Taxation Profit after tax Basic earnings per share (sen) Profit before tax / Revenue margin Profit after tax / Revenue margin (4.91 17.9 1,354.5 (15.1) 47.7 (1631 28.6 66.2 (1.2) (19.11 Interim Dividend 140.01 15.0 113 15.0 15.0 10.9 45.9 3.3 1,433.0 (352.2) 16.5) 2008 2009 1,387.1 (330.7 1,056.4 53.39 2010 2011 PE2011 (21.5) 24.4 1,080.8 2.3 1.2 54.62 51.8% 39.1% 52.39 39.89 Financial year ended 31 March *Based on a 9 months financial period from / 2011 to 31 December 2011. **To be approved at the Company's Twenty Ninth Annual General Meeting on /5 May 2012 EXHIBIT 5 EXHIBIT 7 Statements of Financial Position at 31 December 2011 Statement of Changes in Equity for the Period Ended 31 December 2011 ASHES Promo 71 773 1.778.732 8215.30 SAM TA TO NON CURENT ASEETS 250 TAL. Balance 2010 : Dividende - 10 na 8.013001 14.01 BAS GROSI 31 OM 1 TO AU 2 1.166.002 Pudine Ch TOTAL CURRENT ASSETS TOTAL ASSETS 25.52 2.36 2.1 17:09 75.51 2.790. 2. 2 2.502082343142 0312 4145 1418 220 443 15. LOTS 21 ro-corner Blue 31 March 2011 2011 To compressive Dividende - 9233 1230 mm autofony on.com Balance at 31 Dec 2011 15 LOLOT 600 SI 1092,96 1296.000 . TOUT LTL2 1.578.750 37.53 1772 6.STL 613 12 30 SABTU 3.4.150 37.322 16516 ce 1922 201 8,557,005 Tyritable at wwf the Company 11 Note 2011 TODLIQUITY LATES ALE Dette LIC.000 11 1.97730 L1.42 477 1.0.377 1. TOLOGIES SS SIT 1.54 MOLT 20 hund AU 1.4 33 11214 32T JIH 14AN 341022 Balance 3090 To companie income for the 10.2010 Balance March 2011 April 2011 To companion for the period Concs - 31.03.2011 21.12.2011 Balance at 31 December 2011 1.116.422 TOTALURINT TOTAL LABUTES TOTAL OUTY AND LIARES 5.230.766 1,006,112 192.556 296.00! L, 10 182.5560 129 130 42.555 10.06.2012,71 L72 1.186.422 Monta EXHIBIT 6 Statements of Comprehensive Income for the Period Ended 31 Dicember 2011 2.16.14 3.3.2.7.136.5452 11.57,3856 X I.P.S. 1.727.70 117,87 II ATTE IN 07.01 212 2 0035 1281 ORNI LIN 1 WS hulle we are alwave come to the period 14 w the periode Owes them TO COMPRESORIOS PERIOD 02 13 11 EXHIBITS Statements of Cash Flows for the Period 31 December 2011 2. COMO ETWAS Card metom iuddha Batangerted from spenning CROSON EST ACTIVITIES GPL 72. GP LOL MELINE we 22.000 Posted on my pred Methodning CARLOS ROMANCING ACTS MB 20,000 NASAGASH AND CASOS CASH AND CAMOWIENTS AT BEGINNING OF THE PERIOD YEAR 2.756.000 CASH AND CASHOIRLENTS AT END OF THE PROVUAR 2RM 278 2.70738 21 2.12.296 2117 EXHIBIT 9 SHARE PRICES Highest price RM11.90 RM11.90 + RM8.50 31/03/00 Lowest price RM8.80 = RM10.35 Highest price RM10.40 RM10.40 + RM9.20 31/03/00 Lowest price R19 20 = RM9.80 Highest price RM10.40 RM10.40 + RM9.40 31/03/10 Lowest price RM9.40 - RM9.90 Highest price RM 13.48 RM13.48 + RM9.53 31/03/11 Lowest price R9.63 =RM150 Highest price RM15.84 RM15.64 +RM11.10 31/12/11 Lowest price RM11.10 - RM13.37
Step by Step Solution
There are 3 Steps involved in it

Get step-by-step solutions from verified subject matter experts